
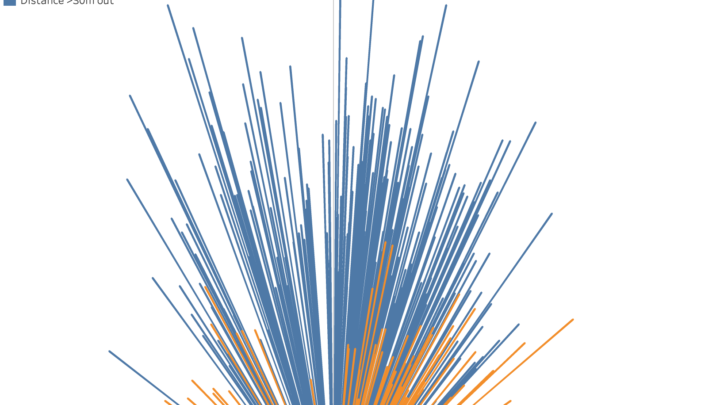
One of the many things I’ve been working on during the off season is kicking spray charts for the NRL and rugby league in general. I’d been wondering if different players had different kicking profiles and if there was a way to visualise this. I got the idea from seeing some MLB spray charts on social media. The idea behind this chart is that it visualises where a player is hitting the ball overall, and allows you to filter down on different variables such as how they fare against certain pitch types. It makes it quite clear what the path...
Continue reading...Advanced Statistics
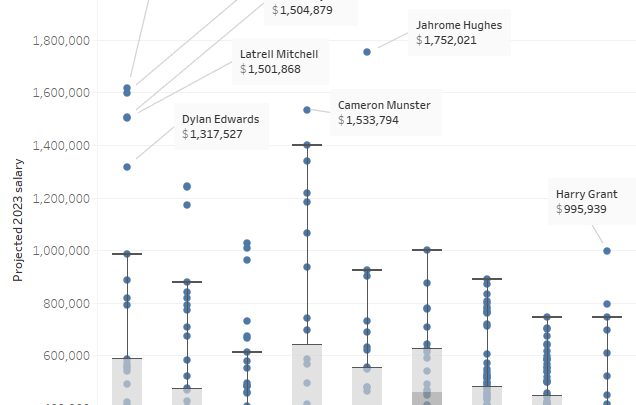
Can we project 2023 NRL player salaries with statistics?
Every season there are always questions around whether NRL players are actually “earning” their salaries, especially those on “reported” big money deals. It’s low hanging fruit. Find a player who’s (allegedly) being paid big money having a bad run of form, find some talking heads from another era to question their performance and you’ve got yourself an easy story. The answer isn’t always that simple. Players have good runs of form, coaches move players into different positions, change the amount of ball they receive, or there’s even lingering injuries that can play a part. What if there a way we...
Continue reading...
First half 2022 NRL advanced statistics leaders
With Round 12 ending on Sunday half of the NRL has already passed. Some clubs might wish the whole season is over. And as we did last season, the half way point is time for the regular review of the Eye Test’s advanced statistical leaders over the first half of the season. New readers to the site may not be familiar with some of these metrics, and if that is the case, I’d highly recommend reading the explainers on some of them to get a better understanding of what I am trying to capture with these measurements. If you’re enjoying...
Continue reading...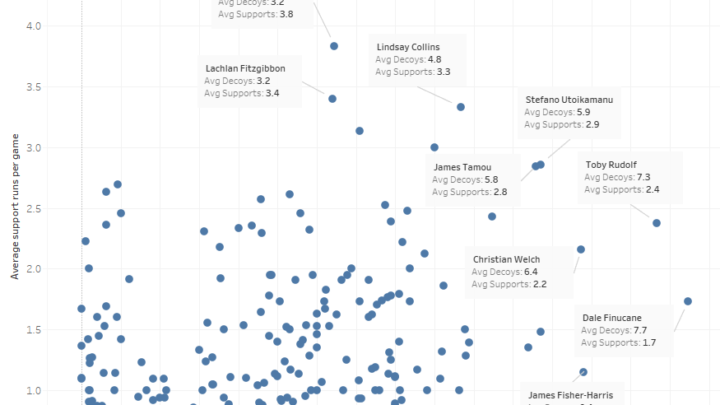
Explainer: Total Run % – improving Run % with decoys and supports
The advanced statistics for the NRL and rugby league in general that Eye Test introduced – Tackle %, Run % and Involvement Rate – have been around for a few seasons now, and I’ve been reasonably happy with the results. They’re not perfect (I don’t and never will claim them to be) and no one single statistic will ever solve any sport, let alone one with as many simultaneous moving parts as rugby league. But as metrics for tracking player workload I feel they offer an accurate representation of what is happening on field. Yet there’s always been something about...
Continue reading...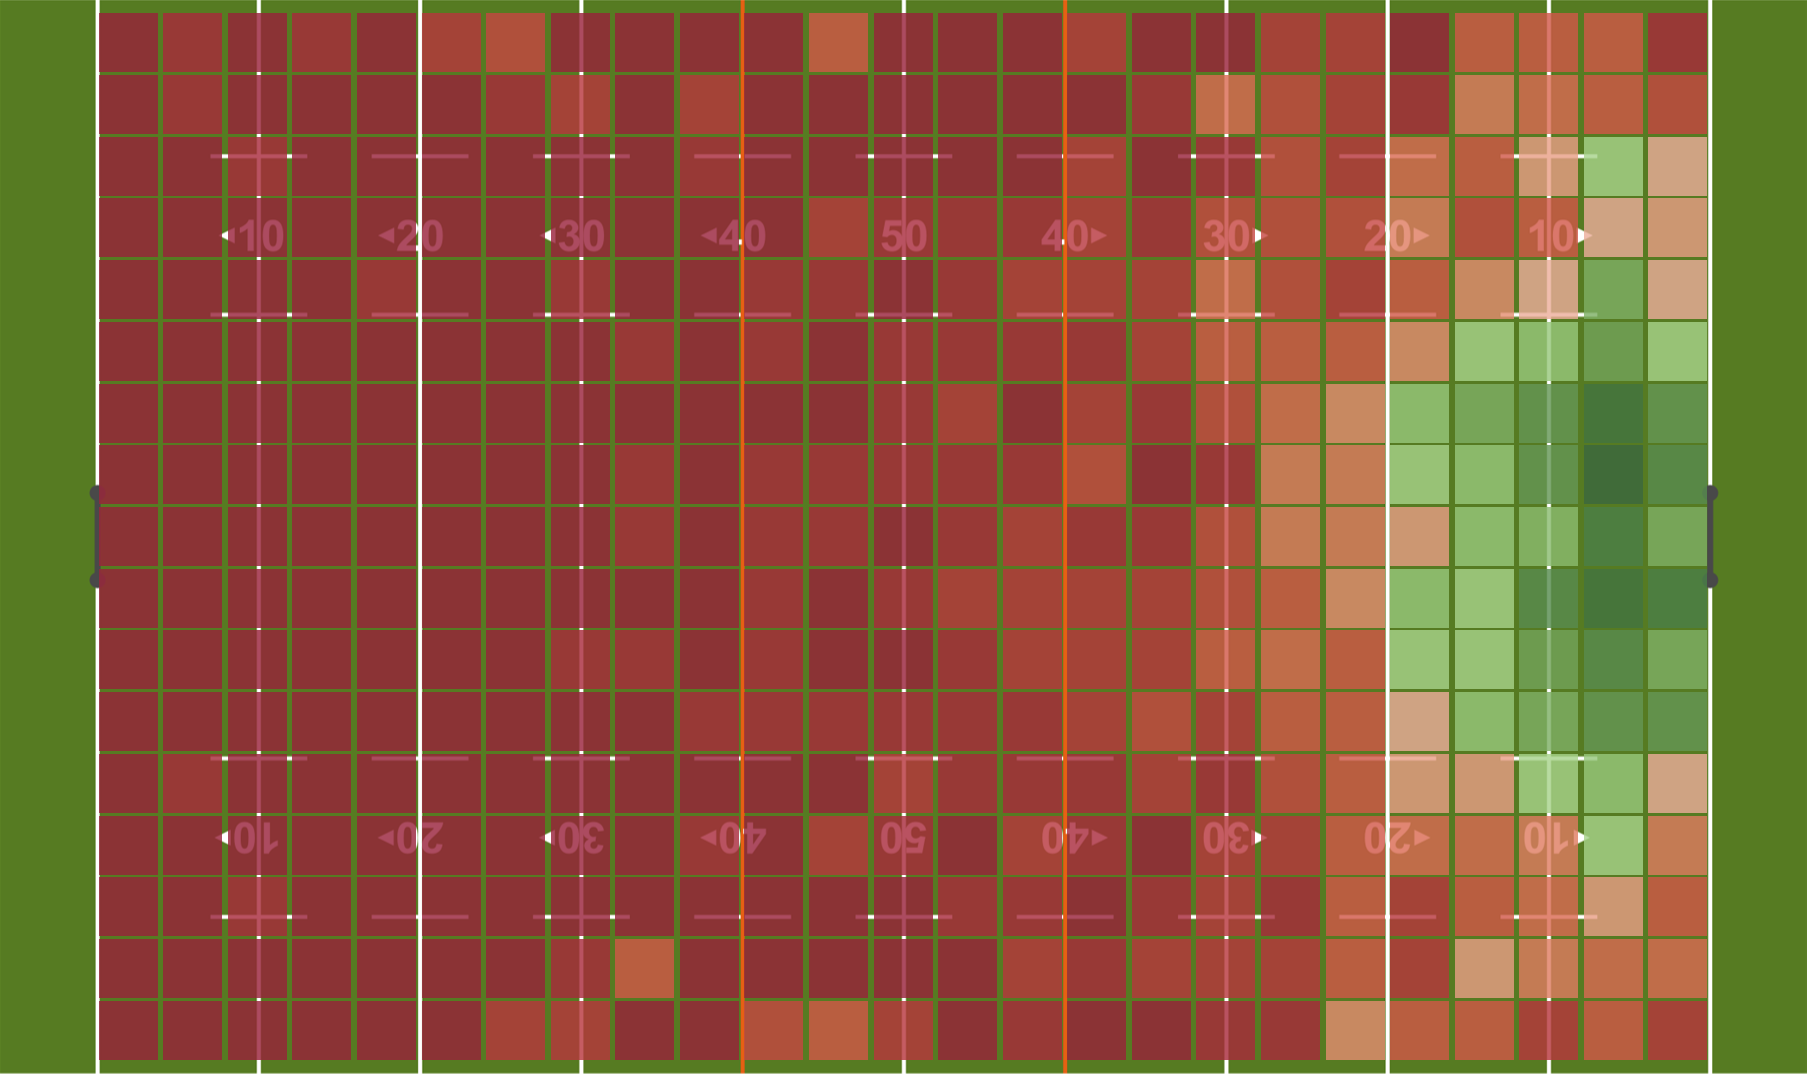
Explainer: Eye Test Expected Points (ETxP) for the NRL
“We stayed in the contest when they certainly had all the field position and a lot of ball. “We just couldn’t get any good field position. We were attacking from the back of the field at some stage and making some good yardage – but it was too far to go.” The above comments came from Wayne Bennett after his South Sydney team lost the 2021 NRL Grand Final to Penrith 14-12. The Rabbitohs were constantly under pressure from the Panthers, with Penrith forcing five drop outs to zero by their opponents. Yet they had a chance to tie the...
Continue reading...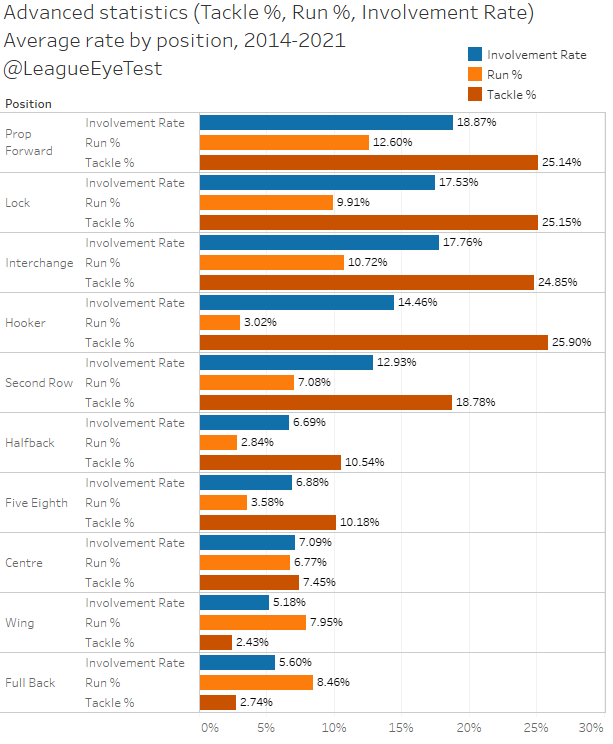
The NRL 2021 Eye Test Advanced Statistic leaders
With the 2021 regular season has drawing to a close it means we can take a look at who were the Eye Test’s advanced statistical leaders for the season. If you’re not aware of these advanced stats, I’d recommend a look at the glossary page for a quick rundown, and there’s further reading on Tackle %, Run % and Involvement Rate as well. Before we start, I want to explain the minimum thresholds for these advanced statistics. For the first three (Tackle %, Run % and Involvement Rate) the cut off is having played 25% of games which is six...
Continue reading...