Last week Rugby League Analytics posted a fantastic visualisation of points for versus points against for every Super League team since 1996, which showed that the majority of teams that either topped the table or won the grand final sit in the bottom right quadrant. This quadrant contains high scoring teams with great defense, which makes perfect sense. Below is the tweet, please give them a follow if you’re into Super League or analytics for the sport.
This led me to wonder if the same trend was evident in the NRL era (1998-2020). Did each Grand Final contain only the best attacking teams who could also defend, or were there some outliers who made to the grand final (or even won it) despite having obvious weaknesses in defense or attack?
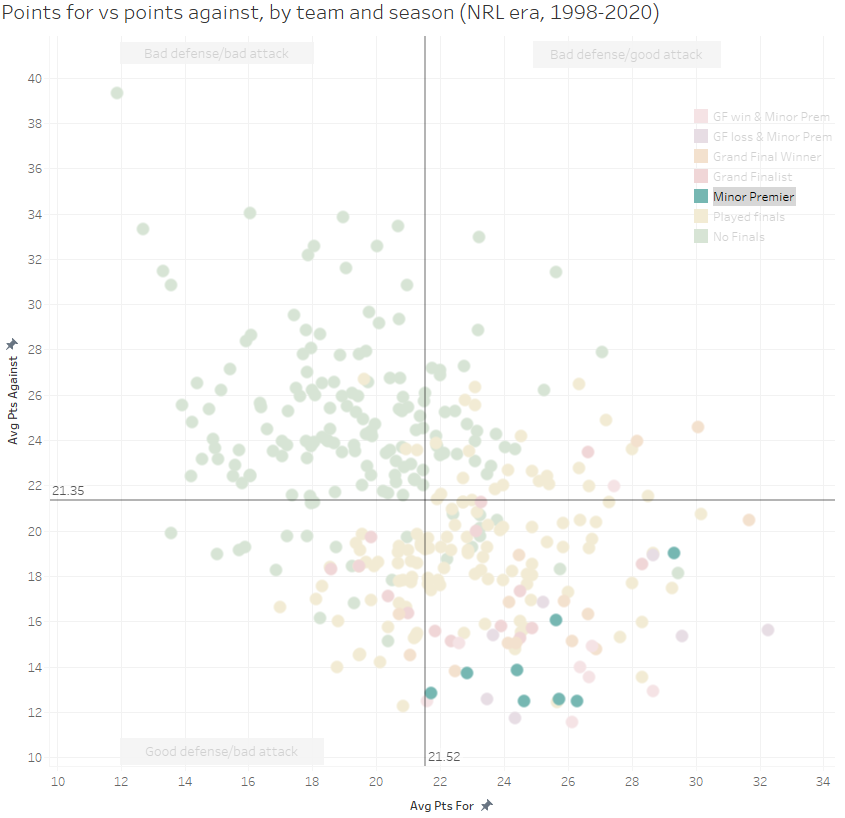
First lets define what we’re looking at. The below scatter plot shows every team in the NRL era, and their average points scored plotted against their average points conceded. All data Is taken from The Rugby League Project, the best rugby league resource on the internet.
I’ve changed the legend up a little bit from Rugby League Anlaytics colour coding, adding a few extra segments. It’s a little bit busier but it allows a greater level of analysis. How they finished the season is still colour coded – pink for winning the grand final and minor premiership, purple for winning the minor premiership but losing the grand final, orange for grand final winners only, red for grand loser, blue for winning the minor premiership only, yellow for a top 8 finish and green for no finals played.
For simplicity sake I’m going to include the discarded grand final wins by Melbourne, which as an Eels fan is pretty painful. Additionally, the “Top 8” moniker is a proxy for finals, I am aware there was a 10 team final series in 1998.
Now we know what data we’re looking at, lets have a look at the overall picture before breaking it down into segments.
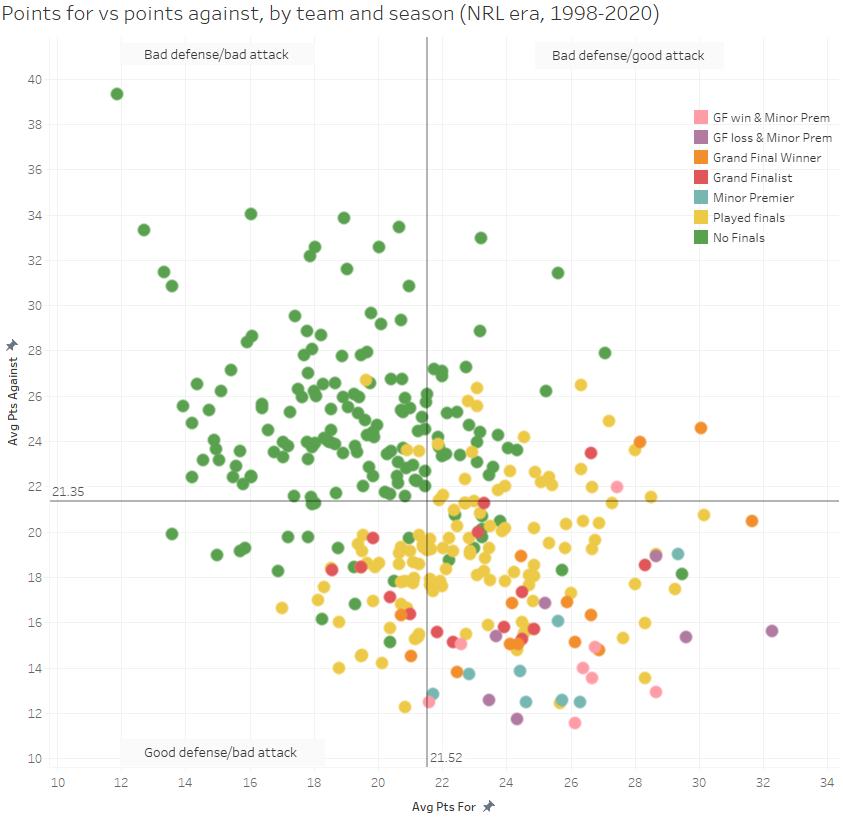
Just like the above chart from Rugby League Analytics, this one has four quadrants. Moving clockwise from the top left have: bad defense/bad attack, bad defense/good attack, good attack/good defense, and good defense and bad attack. Most of the teams sit in the bad defense/bad attack and good defense/good attack quadrants with a few outliers sitting in the other quadrants.
It’s quite clear from that the successful teams look to be sitting in the bottom right quadrant which is the good defense/good attack area. But from an initial glance there are some grand finalists and top 8 teams sitting outside that quadrant. Let’s take a deeper look and see who the were and if it might give some indication of what could happen this season.
Firstly let’s look at those those teams who achieved the minor premiership and grand final win double, the pink data points below.

No team that has achieved this double had a bad attack or bad defense, except for the mythical 2003 Penrith team that defeated the Roosters with that Scott Sattler tackle.
Next up those minor premiers who didn’t win the grand final, the purple data points in the below chart.
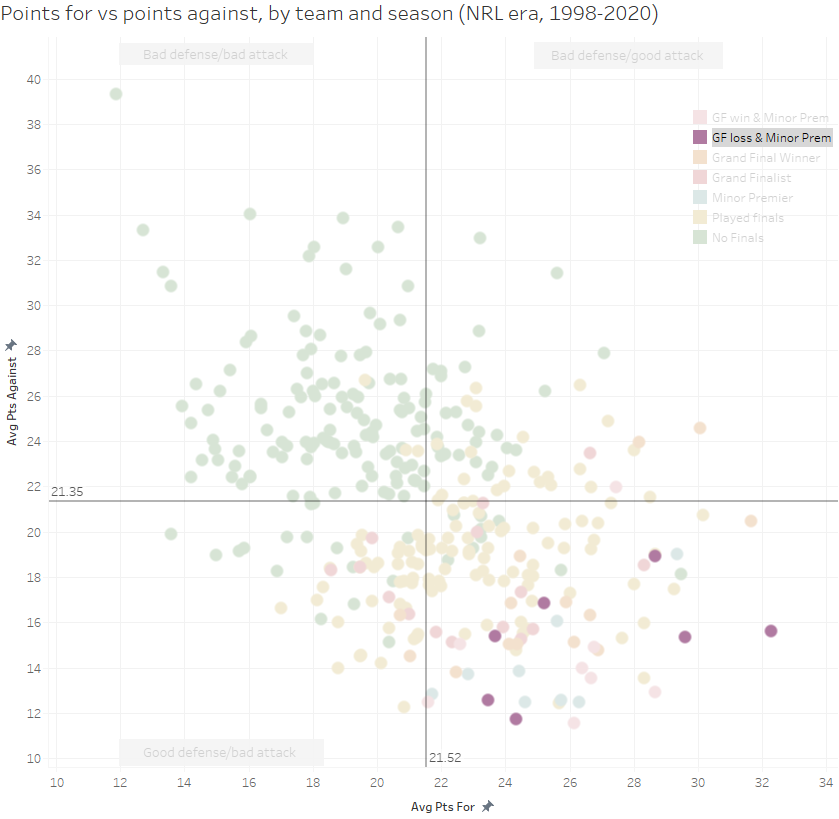
There’s been seven instances of the minor premier making the grand final and losing, and not one of them had anythong other than a combination of good defense/good attack.
What about teams who just won the minor premiership but didn’t make the grand final (the blue data points)?
Again relatively straight forward here – no team that was minor premier but didn’t make the grand final in the last 22 years has had bad defense or bad attack. Again, this is logical, since taking the minor premiership requires a season of consistently good results. I’ve also assumed Penrith wins the minor premiership here with a three point lead with two rounds remaining.
Lets look at grand final winners next, shown in orange.

Of the 22 grand final winners over the past 22 seasons just five of them have come from outside the bottom right good attack/good defense quadrant. The exceptions fall into two groups – historically elite teams like the 2006 Broncos and the 2009 Storm (*cough*), or high scoring teams with a transcend star half. There’s something else those latter two who could score easily have in common and we’ll get to that in shortly.
Now we’ll have a look at grand finalists only, coloured red.

It’s a similar tale, with the majority of losing grand final teams also sitting in the good defense/good attack quadrant. The lone side that lost a grand final despite bad defense was North Queensland in 2005, which also included another team with “bad defense”, the Wests Tigers. Otherwise every grand final team at least had good defense, indicating that at least having a strong defense gives you a chance of making the grand final.
The other thing to note is that those grand finalists within the bad defense/good attack quadrant all occurred before 2006, which is an eternity ago. In the current NRL era, if you don’t have an elite defense you’re not making the grand finals. Pre 2006 NRL seems to be the wild west where you could simply try to outscore a team before the banality of modern NRL where coaches refuse to take any risks and would rather lose a low scoring game than try to win a high scoring one. How good are endless block plays.
Moving on, next we’ll look at teams who played finals football, shown as yellow in the chart below.

This one has a wider spread, although again the majority of teams playing in September had a quality defense, or at least were able to put points on the board. There were a few outliers, with the “worst” team to make the finals being the Canberra Raiders of 2002 who made it in with 10 wins, 13 losses and one draw, and a points differential of -170, sitting well inside the bad defense/bad attack segment.
Let’s flip things now and look at teams who didn’t make the finals, represented by the green data points.
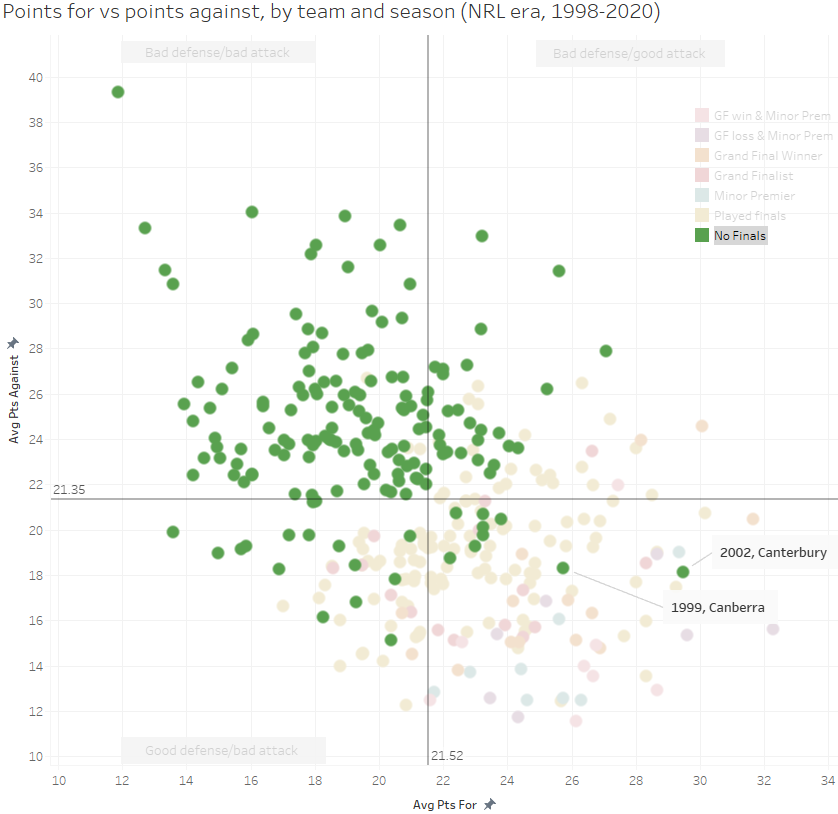
This provides a slightly clearer picture, as teams who have both good attack and defense usually make the postseason. The two “best” teams who didn’t make the finals were the 2002 Bulldogs who were stripped of 37 points, and the 1999 Canberra Raiders. Coincidentally the 1999 Raiders were almost an exact mirror of the 2002 Raiders – 13 wins, 10 losses, 1 draw and a +173 points differential.
After looking at all of this, now we know that you’re unlikely to make the top eight without a good defense, and you’re even more unlikely to make the grand final unless you have a good attack and good defense, where do teams sit for the 2020 season? Here’s the last 22 years with 1998-2019 in blue, with the 2020 season in orange.

The three raging favourites for the 2020 title – Melbourne, Sydney and Penrith –understandably sit in the important bottom right quadrant. The other top four team, Parramatta have sit in the good defense/bad attack quadrant, which was epitomised in the Eels inability to cross the line against Penrith on Friday despite being able to withstand a torrent of pressure in the first half. Both Canberra and Newcastle also sit in this quadrant, signifying that they are also unlikely to feature on the final weekend of the season.
The Knights are nearly inside the quadrant but given their wildly inconsistent results you wouldn’t give them much of a chance even if they were. Of those three Canberra would be the most likely th crash the party and make it to the grand final.
The team I haven’t mentioned yet is one that could be a smokey a grand final win this season – South Sydney. Despite sitting currently in sixth place, they are the only other team besides the top three that sits in the favourable good defense/good attack quadrant. The loss of Latrell Mitchell definitely hurts, but the Rabbitohs have the foundation of a side that could challenge for the title. They aren’t as deep into that quadrant as the other three, but they had started to gain momentum at the right end of the season.
It’s a bit of stating the obvious that there’s only a handful of teams who look like serious contenders this season, but as I’ve stated before analytics is the art of being less wrong . By looking at teams in this lense, we’ve been able to practically eliminate Newcastle, Parramatta and Canberra as legitimate contenders, although the Eye Testtm would have eliminated the Eels a few rounds back and Newcastle would have never been in the conversation.
It’s also shown that you need an elite defense to be even in the hunt for a title, and the most likely grand final winners are coming from Melbourne, Sydney, and Penrith. The final key point is that Souths are a potential dark horse for the title but will face a battle without Mitchell as their defence and attack are good but not on the same level as the other three contenders.
Are the top four running the ball more consistently?
Over the past few weeks, I’ve been delving into the total metres and pre/post contact metres splits of teams in the NRL with a focus on the Wests Tigers, since they’re having issues promoting the ball lately. To get you up to speed here’s the update after Round 18 for pre/post contact run metres for starting forwards and interchange players.
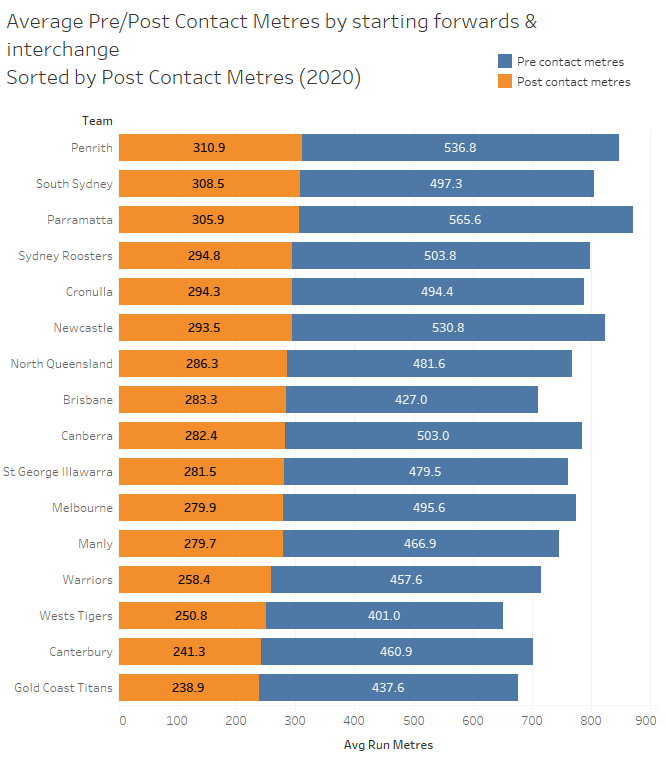
Wests still have the fewest average pre contact and average total run metres by forwards and interchange player and have the third least average post contact metres. On the other end Penrith have the most post contact and are second in total and pre contact metres. This led me to wonder, are the top sides this season consistently gaining metres?
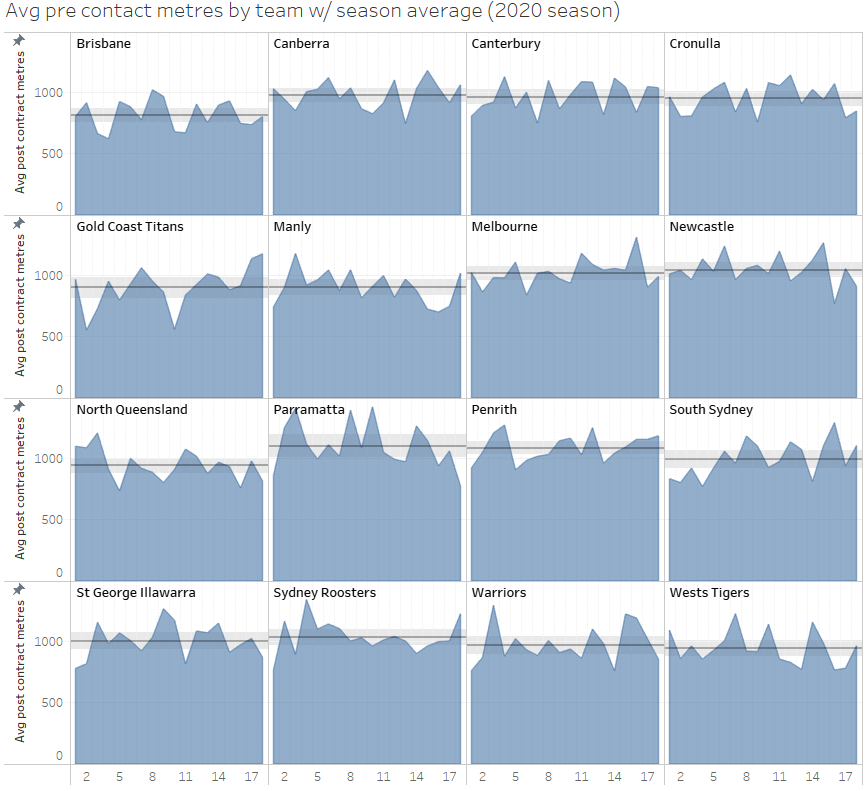
The below chart shows the total run metres per round for 2020 by all sixteen NRL clubs, with a reference line across the middle showing their average run metres, and a 95% confidence interval (95% certain of the true mean sitting in this range) either side.

At first glance you can see that there is more consistency in run metres from some of the top teams. Melbourne, Sydney, Penrith, Souths and Parramatta are either above the line or very close to their average most weeks. Souths notably started the season poorly but have had a strong run of late, while Parramatta were running the ball more effectively earlier in the season but have dropped off considerably of late, which is concerning considering their injuries are to positions that don’t usually run the ball often (Dylan Brown and Reed Mahoney).
Teams who are struggling this season tend to have wilder fluctuations in their total running metres. Brisbane tend to swing wildly above and below their season average, as do North Queensland and the Warriors. The Gold Coast had some very low points early in the season, but their turn around in form has seen them only dip below their season average once since Round 12. And you also have the Tigers, who finally had a game close to their season average after back to back games where they couldn’t move the ball.
One thing to consider here is that we’re looking at total metres gained during a game. What if we looked at just pre or post contact metres? Would that show anything different? Historically pre contact metres correlate better with scoring points, whilst pre-contact metres correlate more with a higher margin.
Above is the same chart but just for pre contact metres. Turns out there’s not a lot of difference, just some of the peaks and valleys are smoothed out a little bit. That makes sense as around two thirds of total run metres come from pre contact metres, with the other third coming from post contact metres.
So, what do you see when you look at post contact metres only?

It’s quite different! Even a team like Brisbane that was struggling has some massive spikes for pre contact metres. The issue, like other bad teams, is that they lose big when they’re not able to generate metres after contact. The erratic season Newcastle is having can be seen here, alternating from high to low post contact metres on a weekly basis over the past two months.
Penrith has seen a huge uptick in post contact metres in the last month when they’ve been lapping teams. Souths have only had one game below their season average in post contact metres since Round 8, which came against Melbourne. Parramatta had been excellent at pushing through contact earlier in the season but that has waned of late.
There is one notable exception to this rule and that seems to be the Roosters, whose run consistency profile shares more with the bottom eight than the top eight. One theory behind this could be that they’re incredibly good at creating space for their outside backs and putting players into huge gaps in the defense doesn’t actually generate post contact metres because they’re not getting touched in the first place.
#BIGMANSZN kicking stats
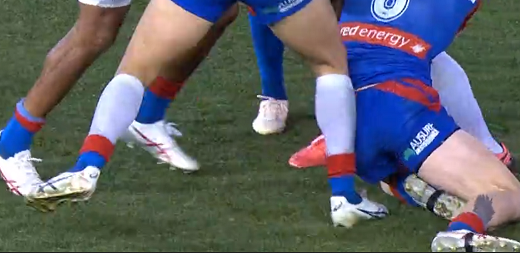
Round 18 was a bonanza for middle forwards moving out of their wheelhouse and trying their chances with a kick. First up was Tom Burgess on Thursday night against the Tigers forcing a line drop out with this deft touch that you can see in the below video:
Second was Martin Taupau kicking and regathering (eventually) for himself against the Bulldogs on Friday Night.
Based on this, I wanted to look and see which forwards had been kicking the ball this season. Most other positions generally have a licence to kick the ball when needed, with middle forwards generally on a tight leash. I’ve also removed second rowers as well, since Wade Graham has kicked over 20 times this season. Below is the table of kicks by middle forwards this season.

This season Adam Elliot from Canterbury leads the way among middle forwards with four kicks and one forced drop out. Des Hasler seems to have the longest leash on his middles, with both Taupau and Jake Trbojevic kicking three times each this season, but without any forced dropouts. The only other forced dropout this season by a middle forward was by the Panthers James Tamou.
So we really did see something of a unicorn on the weekend. Let’s hope we see more of it #bigmanszn.
Net Points Responsible For Round 18 update
Net Points Responsible For (NPRF) is a statistic I put together to track the contributions by playmakers for their team that isn’t always shown in raw numbers for try assists. By including the try contribution statistic that Fox Sports uses it brings in players who don’t necessarily throw the deciding pass for a try. I’d first brought it up earlier in the season in this post, highlighting how well Jahrome Hughes was playing.
Players like Nathan Cleary, Brett Morris, James Tedesco, and Luke Keary show up on the the leaderboards for try scoring or try assists, but that doesn’t always provide a true measure of their worth. And given that defense is just as important in rugby league, I’ve deducted four points for every try cause allocated to a player to use as weighting of their defense.
Here is the calculation for NPRF – tries *4 + try assists *4 + try contributions *4 + field goals but adds in a negative four points for every try caused.
Now that we’ve explained it, let’s look at the top 20 players for NPRF after Round 18:

Nathan Cleary still leads the way but has dropped under 10 points added per game for Penrith. His halves partner, Jarome Luai has been exceptional of late and is adding another 5.6 points per game himself and is one of just eight players have a NPRF of more than 5 points per game.
Let’s not forget that Shaun Johnson has been exception despite allegedly “not doing enough” a month or two ago, and Hughes is still having a very good season.
Here’s the bottom 20:
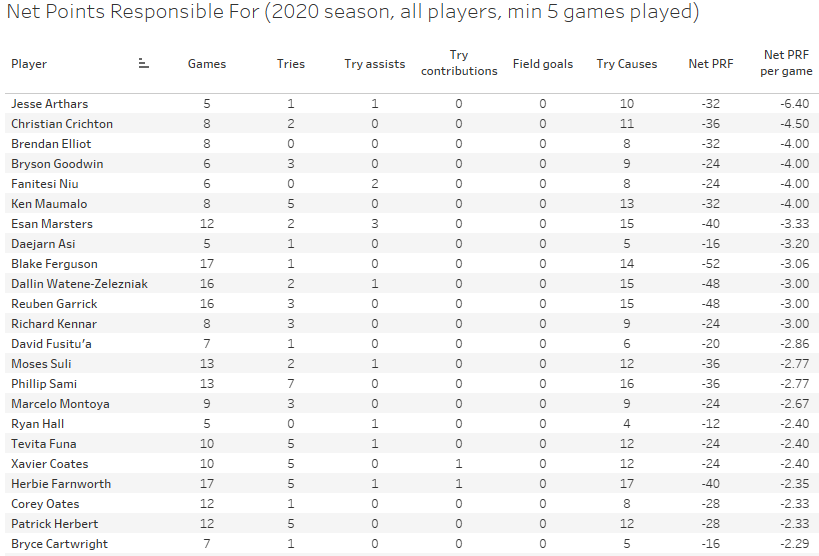
As you’d expect, the majority of this bottom portion of the NPRF table is littered with Broncos, Cowboys and Titans. Jesse Arthars was the worst this season, giving away 10 try causes in just five games for a NPRF of -6.4 per game. Ouch.
The Eels struggles of late down their right edge is seen here too with Blake Ferguson sitting inside the bottom 10, giving away 3.06 points per game. He’s one of the few players in this list to be playing for a top four side, the other notable one being Ryan Hall at -2.4 per game.
If you scan both lists, the one thing that jumps out (especially in the top 20) is the lack of forwards. Other than Cameron Smith, every player in the top 20 is a back or half.
Regular readers will know one of my key tenets is that you (usually) can’t compare players across positions in rugby league as players perform very different roles. With that in mind, lets look at the top 20 players for NPRF filtered purely for forwards, and by forwards, I mean their regular or default position and not named position, as utility interchanges would dominate this list otherwise.

The one thing I like about looking at Net Points Responsible For this way is that it isn’t just hookers leading the way, there’s a smattering of edge and middle forwards as well. A few key takeaways from this list:
– Cameron Smith is in a class of his own as a hooker even at 37, but it’s clear he’s more halfback than hooker with the ball contributing nearly 6 net points per game.
– Tom Startling is having an incredible season for the Raiders, and it’s a crime he wasn’t starting sooner. The return of John Bateman also has played a huge part in their strong recent form, with both players part of the six forwards who have a NPRF average higher than 2.
– Warriors rookie Eliesa Katoa was an incredibly damaging runner for the Warriors, at least when he was fully fit and not carrying injuries into games, adding 2.33 points per game.
And finally, we’ll take a look at the bottom 20 for NPRF segmented for forwards only this season.
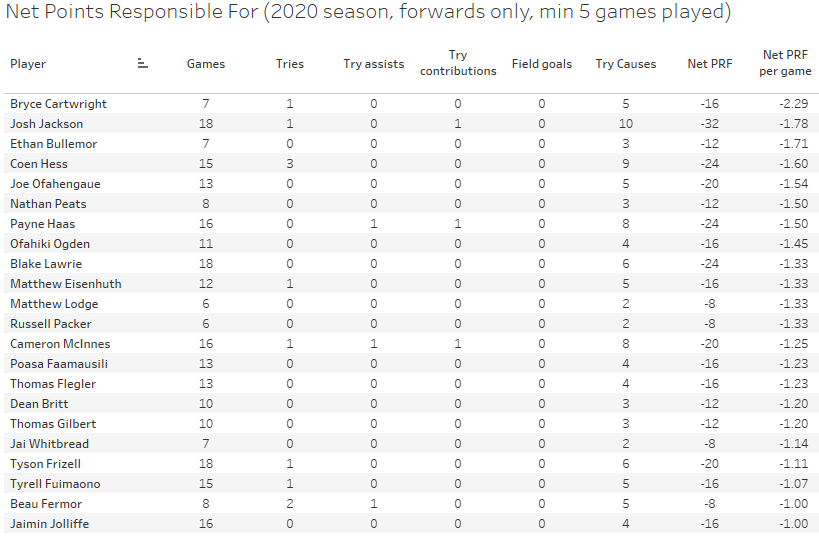
Here we have the Eye Testtm confirmed, Bryce Cartwright is quantifiably the worst defensive forward in the NRL, with he only player in the league averaging over 2 per game conceded. A number of Broncos also make up the top five, along with another reported turnstile in Coen Hess.
It’s also worth nothing is that volumes of tackles don’t equate to quality defense, as Cameron McInnes’ appearance on this list would show. And I wonder how long Josh Jackson will continue to live of his good defensive reputation that was acquired in 2015?