The year of our lord 2021 has not been a banner year, and for our great sport of rugby league it was especially troubling. Thankfully after a one-sided regular season we’ve seen some close and exciting finals games, but it’s difficult to cover up the changes and struggles fans have had to endure this season.
The Eye Test has already summarized all the ridiculous one sided and outlier statistics of the season, but what we haven’t covered at is how the game as whole looked in 2021 and what changed outside of those beatings.
I’m not going to do this on a team-by-team basis, as I couldn’t compete with the tremendous season recaps for each team that friend of the site Liam of PythagoNRL has been producing. They’re a must read for every fan, especially the ones that don’t involve your own team. Instead I’ll be taking the same path as last season, looking at the league as a whole on a macro level to see what trends occurred or what changes came out of the season.
If you’re enjoying the posts on this site and want to support independent rugby league content, please consider donating to The Rugby League Eye Test with a value of your choosing via the link below.
Before we start let’s clear up the methodology. Firstly, as always, I’m using the Fox Sports data, other than time in play which is sourced from the NRL site. Secondly, all percentage changes are comparing per game averages (unless otherwise specified), as there were only 20 rounds last season compared to 24 games and 25 rounds in 2021. It’s hard to show the change in run metres from 2800 to 2900 on the same chart showing an increase in metres per run from 8.86 to 8.93.
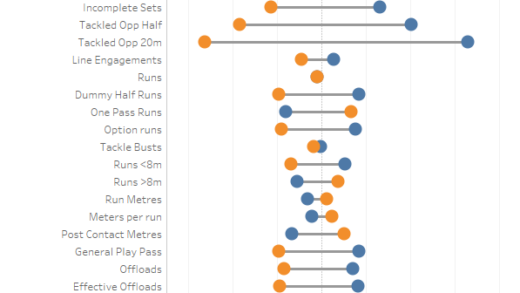
The charts are set up showing the change from 2020 to 2021 (orange dots) or 2021 to 2020 (blue dots). Orange dots to the left means an increase on 2020, orange dots to the left means a decrease from 2020 with the bar in the middle showing the gap between the change from 2020 to 2021 or from 2021 to 2020. It’s not elegant but I find it’s an effective way of highlighting the largest changes year on year.
Scoring and attack
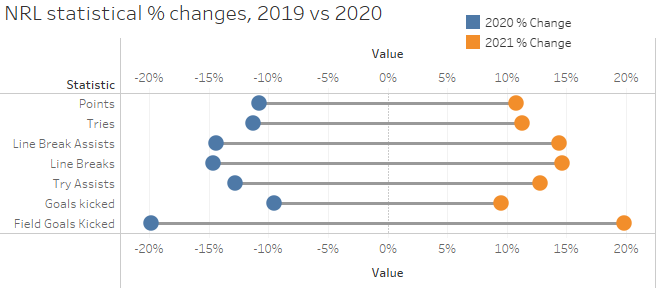
This is probably the least shocking chart in this post. Double digit increases in all scoring categories, with points and tries up 11% on last season. The biggest change though is field goals kicked, which increased by 20%. The two point field goal may just be the only decent rule change brought in by the current administration.
An easy way of visualising the change in attack this season is looking at heat maps of tries scored for 2020 and 2021, which can be seen below.

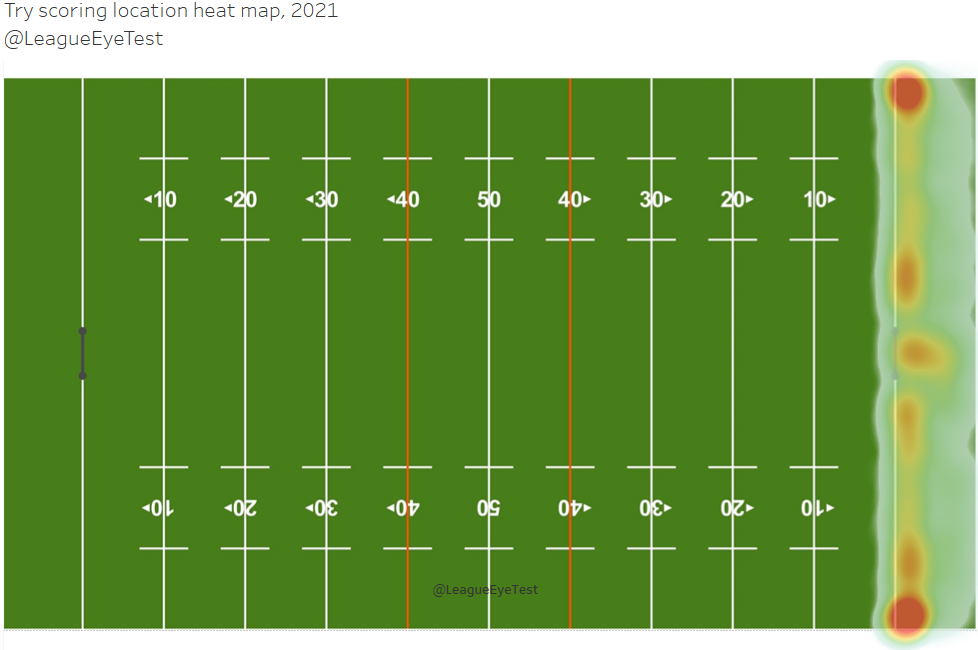
An increse in intensity of data points in the middle of the in goal area can be seen here. Traditionally under the posts hasn’t been a high scoring area for NRL teams, yet in the era of over fatigued middle forwards the number of tries scored by big bodies just waltzing through the centre of the park and over the line jumped significantly.
Time in play
For all the talk of wanting to speed up the game and reduce stoppages, the one thing that increased this year was stoppages.
The average time in play dropped by nearly two minutes, from 55.9 minutes of play down to an average of 54.1 this season. For all the talk of wanting to speed the game up, the average time in play in 2021 was almost identical to 2019 (54.2). Another example of fixing a problem that didn’t exist.

The startling part of this drop is that not only was it a sizable drop in ball in play, but since Round 6 only one round averaged more than 55 minutes of play in game (Round 16) and all but a handful of rounds averaged more than 54 minutes per game. The average ball in play since Round 6 was only 53.5, well over two minutes per game down on last season.
Nevermind the fact that trying to keep the game flowing and trying to increase the amount of points scored are mutually exclusive. You can’t have more time in play and fewer stoppages with more tries, because the mere fact of scoring creates stoppages. The more tries you have the more stoppages there are, as you can see by the below chart plotting average number of tries scored per round (blue columns) with the average time in play (orange line) for the past three seasons.
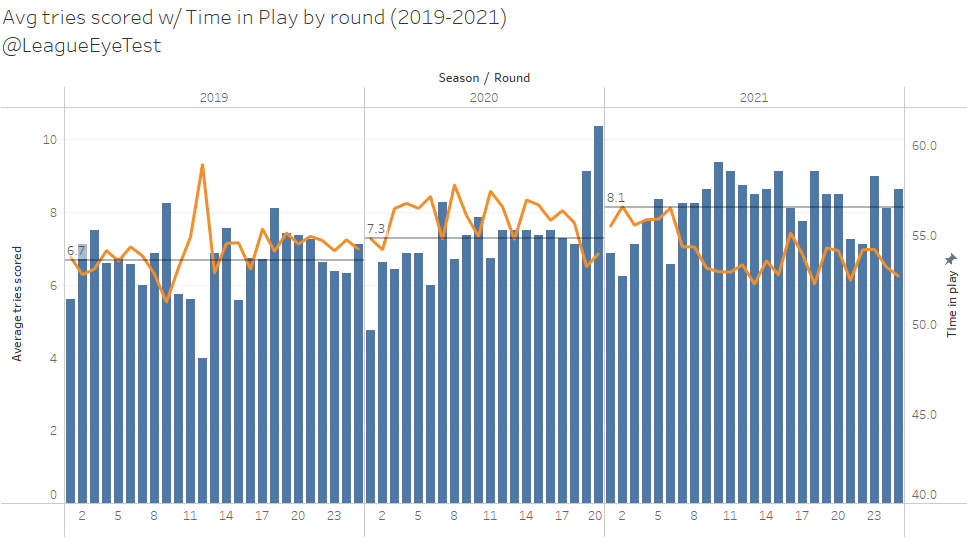
You can have more time in play or more tries. Not both.
Possession
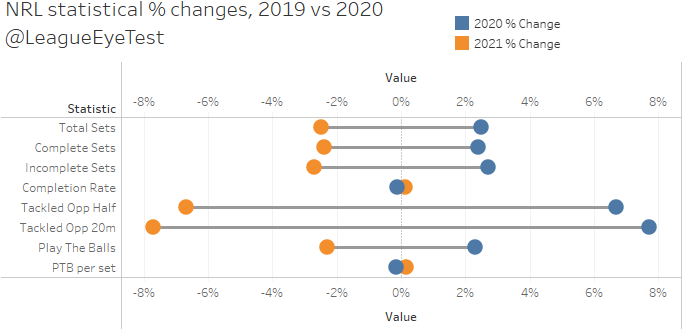
One change this season was that there were fewer play the balls on a per game basis compared to 2020. That’s after a 7% increase in 2020 and well above the the average back to 2014, so we’re still living in an era statistial inflation. Keep that in mind when you’re comparing 2021 to previous seasons.
Total play the balls declined by 2% per game, with teams attempting 2% fewer sets. In per game averages this equates to 288 play the balls per game (down from 295 in 2020) and 78 sets per game. The number of tackles per set remained constant however (3.7 per set), so when they did have possession, teams weren’t doing more with less, or less with more.
Completion rates, which we established earlier this season as a myth and have no correlation with winning games, barely changed from last season. Completion rates were on the same level as 2020 at 78.4% this season. This comes after the completion rate from 2015-2019 had sat firmly in the 76% range before a big spike of +2% in 2020 with the set restart change.
With the increase in scoring and attacking plays this season, it makes sense to see a 7% increase in teams tackled in an opponent’s half and an 8% increase of being tackled inside an opponent’s 20 metre area.
Set Restarts & penalties
With now two infringements (Inside 10 metres joining ruck infringements), the number of set restarts called jumped by 6% this season from 7.1 to 7.5. With 10 metre infringements ranging from 20-30% of set restarts called per round, that means ruck infringement transgressions actually declined this season. I’m sure the players were much better behaved in 2021 despite being considerably more fatigued.
The below chart shows the average penalties awarded per round for the past two seasons.

You can see the Magic Round “crackdown” lasting for about five weeks, which seems about right. There was a corresponding “crackdown” later in the season as well which lasted about two weeks.
When you look at the same chart, you’ll see that despite the threats of a set restart crackdown for teams consistently flaunting the rules, there was no such thing this season. Especially not around Round 10 when the penalty crackdown started.

The only real trend was the absence of set restart calls over the final three weeks of the season, culminating in the final round of the 2021 season having the fewest six again calls of any round since the rule’s inception, despite 2020 having half as many reasons to call one. It seems like there was some sort of unspoken rule to reduce the impact set restarts had over the final few weeks of the season leading into the finals.
Running and metres
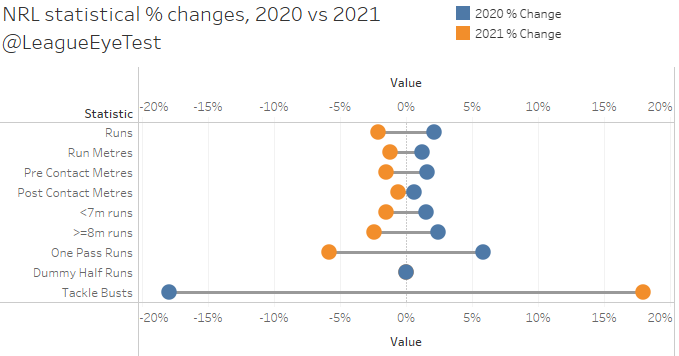
Unsurprisingly with so many points being scored, and fewer play the balls, there was a drop in runs and running metres. After all you can’t run the ball when you’re watching a teammate or opponent take a conversion. Total run metres per game declined by 1.2% after increasing by nearly 3.8% in 2020, with this season seeing 2,880 metres run per game on average.
This came from 2% fewer runs in 2020, which you’ll note is a larger decline than for metres gained. Therefore obviously metres per run increased, and they did by 0.8% to 8.93 per run, up from 8.86 per run in 2020. Most of this was from post contact metres per run, which increased from 2.94 to 2.98 per run, while post contact metres gained as well from 5.92 to 5.95 per run. It’s only a handful of centimetres but over the course of 320 runs per game those numbers can add up.
One pass runs, which increased significantly in 2020 with the introduction of set restarts, dropped back to 2019 levels as a percentage of total runs.
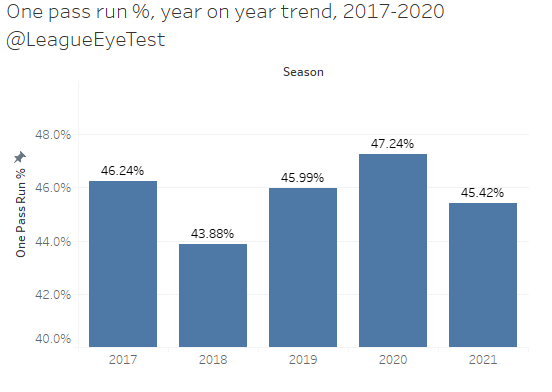
This looks to have come at the expense of dummy half runs, which increased as a share of total runs for the first time in multiple seasons.

With set restarts being awarded for offside players as well as ruck infringements, it appears that players are darting out of dummy half more to try and catch players offside or out of position at the expense of the traditional and slower one out run. Whatever the reason, the tedious one out running looks like it was quarantined to 2020. If only that was the case with certain other things.
Another running change this season was the change in positions taking one pass runs. The below table shows the average number of one pass runs by position for the last two seasons.

Middle forwards, interchanges and wingers are still doing the lions share of the work, but they’ve all seen fewer hit ups per game this season. The one position that has seen any meaningful uplift in one pass runs per game this season was centres, whose average moved from 20.5 to 21.3 per game.
As theorized earlier in the season, with players tiring earlier in games due to fewer stoppages and a faster pace, interchange players are spending more time on field due to starting middles not being able to play at the same rate. This also explains centres needing to run the ball more as a break for traditional hit up positions who need a break. Depth across the park mattered this year, and those who recruited big bodies with poor lateral quickness or agility suffered.
Tackle busts was the big change for running statistics this season, with nearly 18% more tackle busts recorded in 2021. That’s an extra nine per game, up from 51.5 to 60.7. Most of them were probably from Tom Trbojevic alone…
Passing & errors

If 2020 was the year one pass hit up, then 2021 was the year that spreading the ball and second phase play returned to rugby league. General play passes (not including passes from dummy half), grew by 3% this season, and offloads also increased by 4% after declining by 5% in 2020.
The safe, one out style of 2020 has been buried (at least by the top teams), and now the meta is exploiting tired or limited defenders with ball movement. The one surprising thing about the increase in ball movement this season is that errors dropped by 3%, something you wouldn’t expect with more players looking to offload.
The intriguing thing about the extra passing and attacking more is that it didn’t result in players being tackled any wider. Below are the heat maps for players tackled on tackles 1-5 for 2020 and 2021. You can see some slight variations from year to year but no significant changes, and even at a team level there’s not too many differences.
There’s a thing about errors though, which is pretty important if you’re basing your strategy around holding the ball or generating empty possessions.
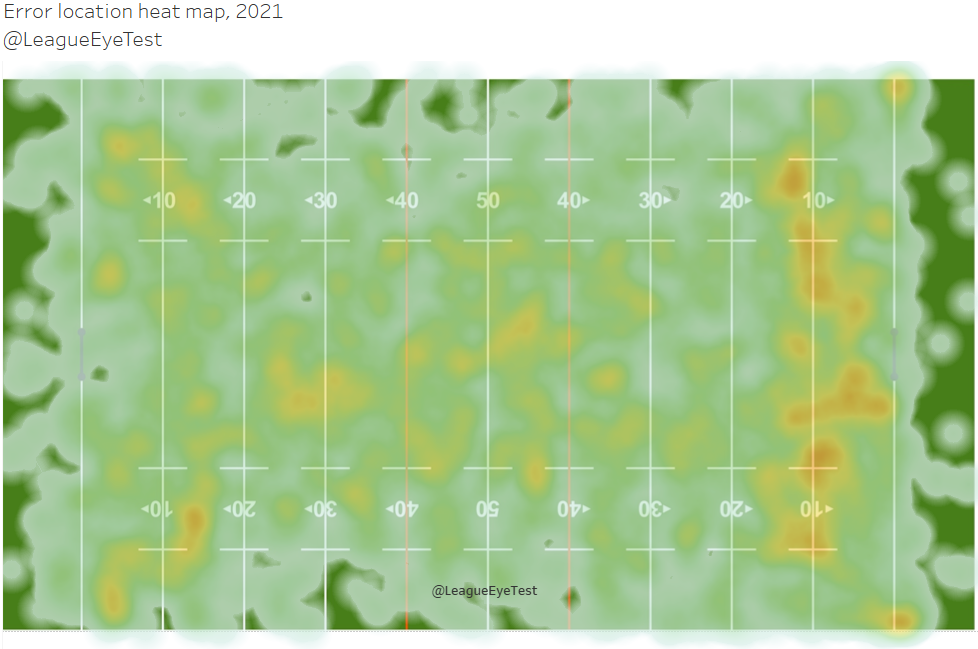
The part of the field with the highest intensity of errors occur between 15 metres and an opponent’s goal line, which means if you’re reducing your errors there’s a chance you’re also reducing your chances of scoring. There’s no reward without risk.
Kicking
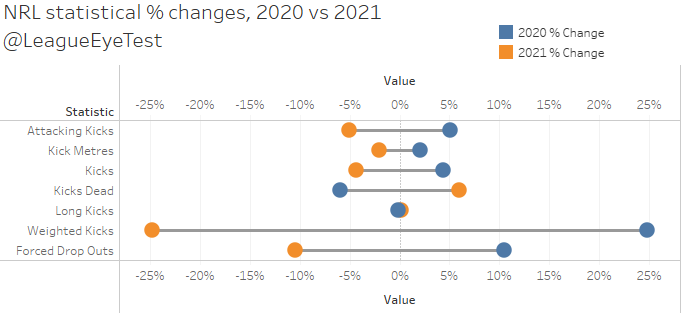
In 2020 we saw kicks dead decline by 6%, yet in 2021 they returned to their former state with an increase of 6%. Last season was the peak since 2014 with 41.5 kicks per game, with the 6% decline bringing the average back under 40 to 39.7 per game in 2021.
Total kicks dropped by 4%, interestingly again wiping out the increase of 4% in 2020. Long kicks, which had an 11% jump in 2020 were flat in 2021, with a 0% change. With teams making metres up the field due to restarts and tired defenses, kick metres also declined by 2%.
What didn’t change was the continued decline of weighted kicks, which decreased by 26% in 2020 and another 25% in 2021. The result of this was a continued decline in forced dropouts, which fell by 1% in 2020 and another 10% this season to just 2.9 per game, down from a peak of nearly 6 per contest in 2017. It’s clear as it was last season that attacking kicks aimed inside the in-goal area are a relic of the past.
Defense
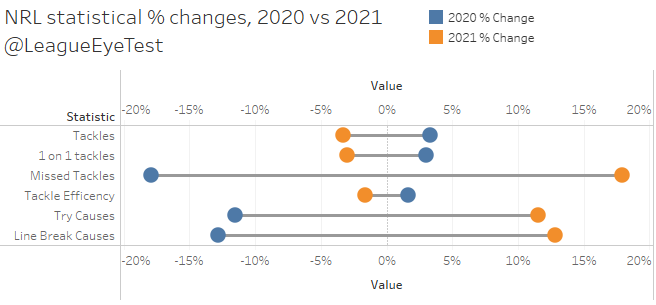
If you’ve been paying attention, the fact there’s been fewer play the balls and runs would naturally mean fewer completed tackles. And you’d be right, with a drop in tackles made of 3% after an increase of 3% in 2020. There were still 600+ tackles made per game this season, down from the high of 630 per game in 2021, which was only the second time since 2014 there was more than 600 tackles completed on average per game.
What did change though is the massive increase in missed tackles, which was evident before with the huge jump in tackle breaks. Missed tackles skyrocketed by 18% in 2021, resulting in a big drop in Tackle Efficiency of 1.6% to 90.93%. That’s a big change, which hasn’t dropped below 91.4% since 2014 and had been above 92.4% in the past two seasons.
And as we saw with scoring, there was a big increase in points, tries and line breaks. To be expected there were double digit increases in try causes (12%) and line break causes (13%).