Earlier this season I introduced the Eye Test Player Contribution Rating (ETPCR) for NRL players and the feedback and results so far have been encouraging. It’s not perfect – measuring a hooker’s performance is nigh on impossible with traditional statistics – but the basics are there of something useful and it’s been a popular addition to the site.
With the 2022 NRLW season starting on the weekend, this week’s post will focus on applying it to the women’s game and the results obtained. We’ll highlight the top and bottom NRLW players since 2018 by ETPCR, the differences in the distribution of scores between the men’s and women’s competitions as well as detail some of the issues in applying it for NRLW games.
If you’re unaware of what ETPCR is, I’d highly recommend reading the explainer on the site which goes into substantial detail about how it was derived and what it hopes to accomplish, as well as some limitations with the model.
If you don’t have the time, then here’s the cliff notes. It is a possession and minute adjusted player attribution metric, to show the points value a player is worth over an average player. In the ETPCR model, the average player is worth 0.0 points.
To get a players ETPCR, first we must find out which statistics that correlates positively or negatively with margin of victory. Then we take the weight of positive statistics (e.g. tries, line breaks, tackle busts, offloads, run metres) and subtract the weight of negative statistics (e.g. missed tackles, errors, line break causes, try causes).
From this number we adjust for the number of points scored and conceded in a game, the minutes played by the player and finally the number of possessions in said game. This last number is crucial, as possession is rarely even across both teams during a game. By normalising possession, it allows consistent comparisons across players without the bias of extra play the balls.
A great example of this came from NRLW Round 4 last season when Gold Coast beat Brisbane 28-26. The Broncos actually had more possession in that game – 116 play the balls compared to the Titans 90. Even though the scores were close, Brisbane had nearly 30% more possession and their statistics would have been inflated accordingly.
By normalising all NRLW games to 230 possessions play the balls (115 each in attack and defence, the average number of play the balls in a women’s game) we eliminate any unfairness across players as they are all set to the same level playing field. For reference, the mens model is normalised on 270 possessions per game.
Before we get into the analysis I’d like to offer a disclaimer that I didn’t see anywhere near as much of the NRLW 2021 season as I’d liked due to COVID and other family illnesses. If there’s any major mistakes or errors with any of my analysis or assumptions below, please drop me an email or DM.
Top & bottom NRLW players by ETPCR since 2018
With that out of the way, let’s get into the numbers. All data is from Fox Sports Stats as usual. Here’s the list of the top and bottom 20 players by ETPCR for all NRLW seasons since 2018 with a minimum of two games played.
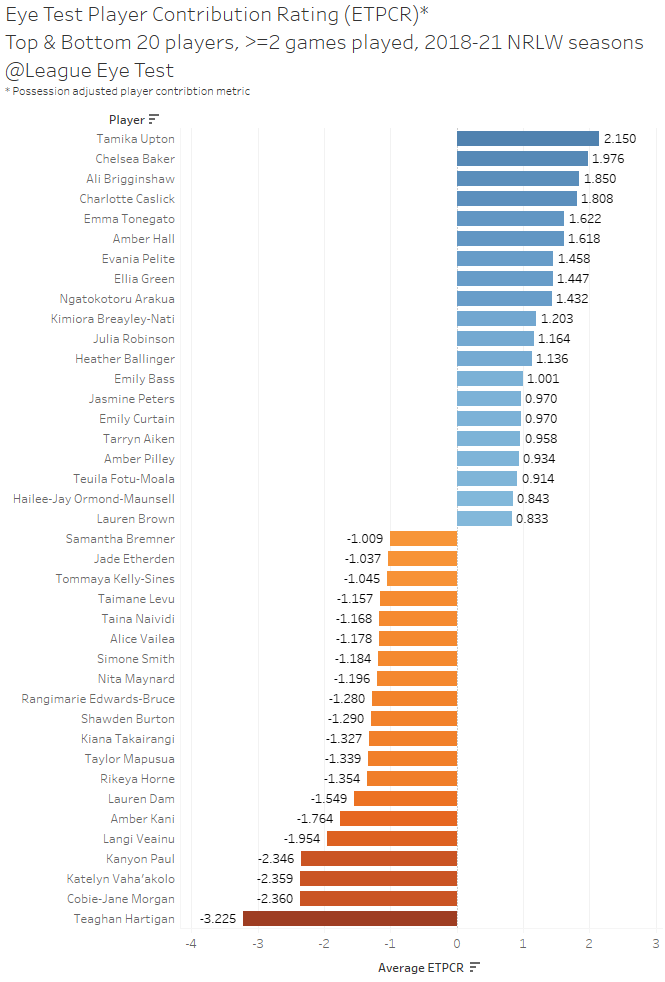
The positive thing looking at this list is that, like the NRL model, it passes the Eye Test (not the one you’re reading, the actual one).
Tamika Upton has an average ETPCR of +2.150 from her 11 NRLW games, the highest of all players since the league’s inception in 2018 and the only player with a career average above +2. This means on a per game average she is contributing 2.150 more points than the average player across 115 possessions. It goes without saying that her addition will be a massive boost for the Knights this season.
Second spot goes to the now retired Chelsea Baker, who averaged +1.976 from her seven games with the Broncos in 2018-2019. Her Brisbane team mate Ali Brigginshaw rounds out the top three with an ETPCR average of +1.850 from 11 games.
One of the reasons I used a two game minimum, other than to weed out single game anomalies, was to highlight how good Charlotte Caslick was in her short stint in rugby league. The two games she did play for the Roosters following the postponement of the 2020 Tokyo Olympics resulted in a +1.808 ETPCR, fourth best in of all players since 2018. Hopefully we’ll see her back in the better rugby code before her career ends.
The other names inside the top 20 feature names most people would expect to see here. Joint winners of last seasons Dally M Emma Tonegato sits just behind Casslick in 5th place at +1.622, whilst the player who shared the medal with her (and Eye Test Hall of Famer) Millie Boyle places just outside this top 20 in 23rd spot at +0.792.
The remainder of the top 10 is filled out by Broncos prop Amber Hall (+1.618), Titans back Evania Pelite (+1.458), former Warriors back Ellia Green (+1.447), former Knights forward Ngatokotoru Arakua (+1.432) and Titans half Kimiora Breayley-Nati (+1.203).
Arakura’s position is interesting since she played primarily off the bench. When looking at distribution of positional ETPCR scoring for the mens game (more on this below), there’s no middle forward or interchange inside the top 20 for the NRL for average ETPCR this season (Jason Taumalolo is 21st) and there’s only one prop inside the top 30 (Payne Haas at 29th), and no interchange players inside the top 30.
For the NRLW though, in total there’s 13 players in total averaging more than +1.0 ETPCR per game and 22 players averaging more than -1.0 ETPCR, which makes sense given there are always going to be more replacement level players than elite ones. On the flip side, there was exactly 20 players with an average ETPCR of -1.0 or more, with four players conceding lower than -2.0 more points than the average NRLW player.
What about just 2021?
When you narrow the same chart above down to just 2021, there’s a similar group of names at the top.
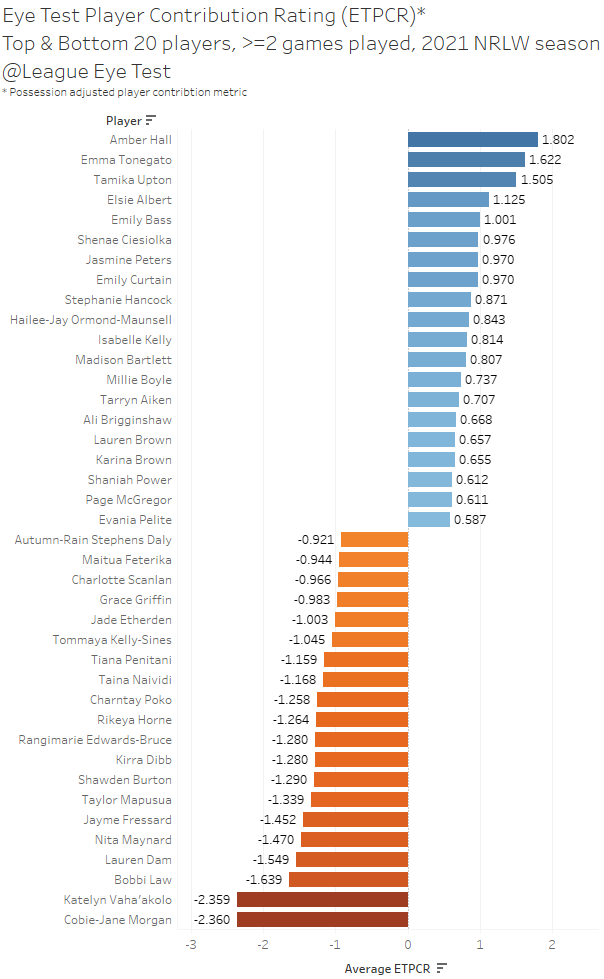
Joint Dally M winner Amber Hall took top spot at +1.802, followed by Tonegato (+1.622) and Upton (+1.505) rounding out the top three. Elsie Albert and Emily Bass were the only other players to have an ETPCR above 1.0 for the season.
As a way of sense checking the output for the NRLW competition, here’s the Rugby League Players Association’s NRWL “Dream Team” for 2021 with their rank and ETPCR for the 2021 season following each name.
1. Emma Tonegato (Dragons) – 2nd, +1.622
2. Karina Brown (Titans) – 17th, +0.655
3. Jaime Chapman (Dragons) – 67th, -0.046
4. Shenae Ciesiolka (Broncos) – 6th, +0.976
5. Teagan Berry (Dragons) – 62nd, -0.014
6. Taliah Fuimaono (Dragons) – 23rd, +.525
7. Rachael Pearson (Dragons) – 45th, +0.243
8. Elsie Albert (Dragons) – 4th, +1.125
9. Lauren Brown (Broncos) 16th, +0.657
10. Millie Boyle (Broncos) – 13th, +0.737
11. Amber Hall (Broncos) – 1st, +1.802
12. Shaniah Power (Titans) – 18th, +0.612
13. Destiny Brill (Titans) – 32nd, +0.419
Overall that’s a pretty decent hit rate with players perceptions, and I wouldn’t be expecting an exact match anyway.
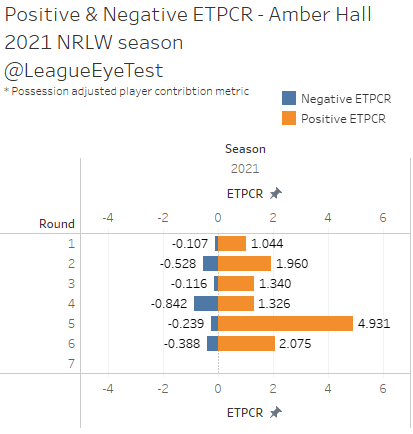
Hall was one of the best players in the competition last season and was consistently a net positive player, including a whopping +4.621 in Round 5, the third highest individual ETPCR score of the season.
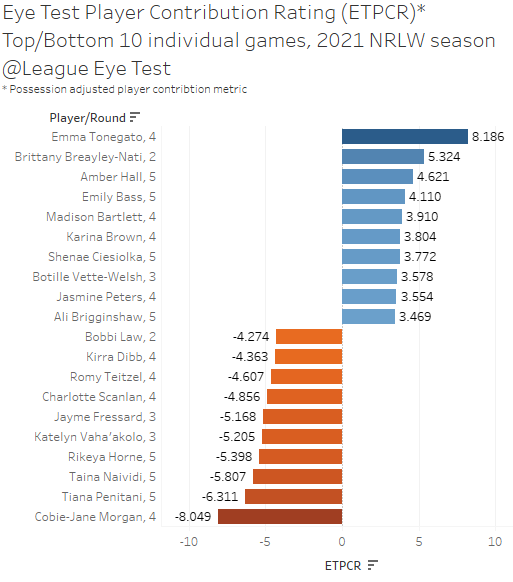
Below is the top and bottom 10 scores for last season as well, where you can see Hall, Tonegato and Brittany Breayley-Nati dominating.
The two big outliers in the Dream Team listed above are Jaime Chapman and Teagan Berry, both playing in positions that concede a high number of tries which dragged their total ETPCR down and subsequently ranking them in the 60s. I’ll get into the positional breakdown of ETPCR for NRL and NRLW later.
Indeed, if you look at the splits for positive and negative ETPCR, Berry ranked 23rd for positive ETPCR at +1.456 and Chapman 26th at +1.371. Looking at negative ETPCR, Chapman and Berry ranked 103rd and 104th respectively out of 133 total players. Position wise Chapman was 12th among 19th centres and Berry was 12th out of 21, so whilst they were very strong with the ball, they were mid field defensively.
The fact both played in the grand final probably helped their cause, but both were clearly worthy choices. And I’m not going to argue with the players opinions.
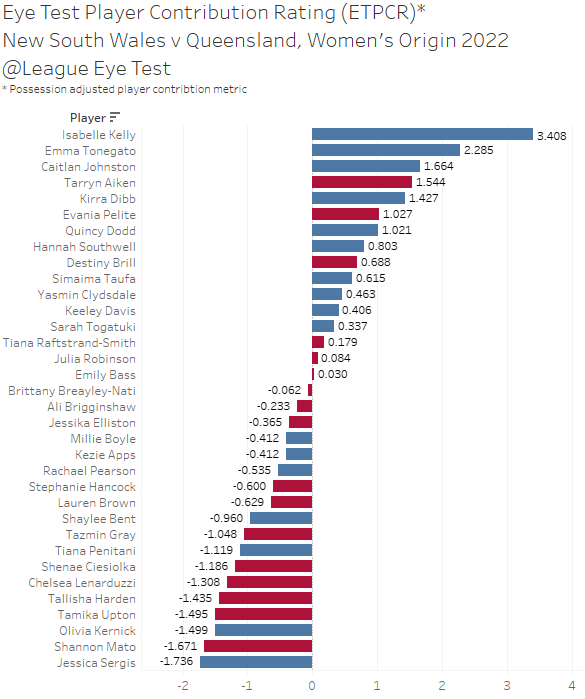
One thing I’ll definitely be keeping an eye on this season is the performance of Newcastle’s Caitlan Johntson, who only played one game in the 2021 season for the Knights which returned an ETPCR of -0.174. Yet she dominated the women’s Origin game this year (see below) and I’ve already got her penciled in a possible future Eye Test Hall of Famer.
Players not returning for 2022
Friend of the site Liam from PythagoNRL noted something whilst looking at the rosters, that 37 in total won’t be returning, almost two full rosters worth.
Here’s the 37 players being replaced in 2022 sorted by ETPCR from highest to lowest.
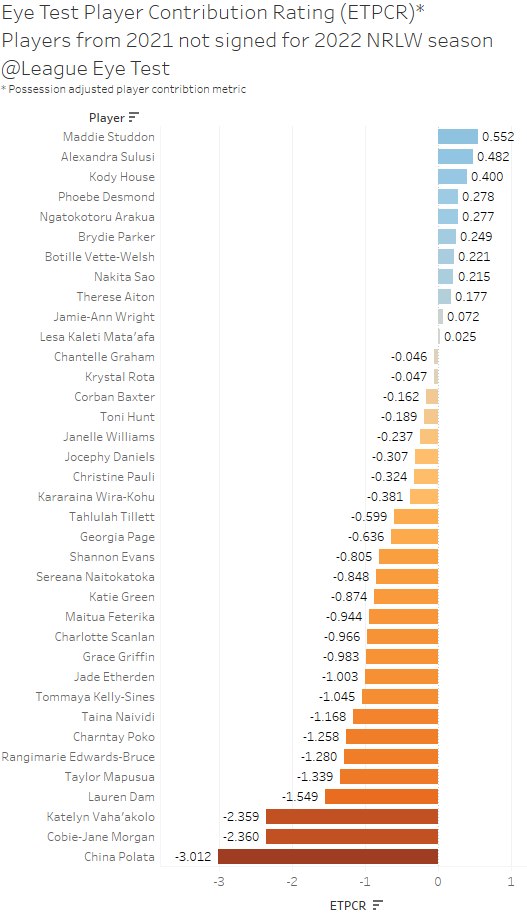
Of the above 37 players who aren’t returning for 2022, some of them are due to injury, illness, retirement, or pregnancy. 14 of them were from the Knights and 10 from the Eels, which given their ladder position last year makes sense. Eight of that 37 only played one game in 2021 as well.
Once you put a line through those players, there’s very few net positive players who didn’t get picked up.
Maddie Studdon is the highest profile and ranked 21st for ETPCR for the 2021 NRLW season at +0.552. Whilst she missed out this season on a deal, with the addition of four teams in 2023 and nearly 100 extra roster spots and her level of experience, you’d have to think she would pop up somewhere eventually.
Arakura wasn’t re-signed by the Knights and as noted above has a top ten career ETPCR rating, which is unusually high for a prop. Her numbers for 2021 were still net positive at +0.277. Phoebe Desmond was another Knights forward who was one of just a handful of Knights players to cross the line in 2021 and her ETPCR of +0.278 is another net positive player who wasn’t picked up for this season.
But otherwise, it’s slim pickings for net positive players from last season currently unattached. The turnover for net negative players could be an indication of a greater depth of replacement level players and an encouraging sign for expansion, although jumping to 10 this soon might be a bridge too far as the level of elite players doesn’t appear to be growing at the rate of other groups. The game may also be evolving so quickly that some of the competitions first batch of players may not be able to keep up with it. It’s also clear that there’s a very obvious pool of talent from sevens rugby, not that this would be earth shattering news to anyone following the competition closely.
Player ETPCR distribution by position
Again, we’ve got the issue of small sample sizes but there’s still something to work with here. Below is a box and whisker plot of all NRLW players with at least two appearances since the inception of the league in 2018. The chart is a box and whisker plot, which can be used to show the spread and a five number summary of a set of data. The numbers are the minimum, first quartile (25%), median, third quartile (75%) and maximum. The outside of the boxes represent the first and third quartiles, the middle of the box is the median and the “whiskers” at the ends are the extremes of each sample of data.
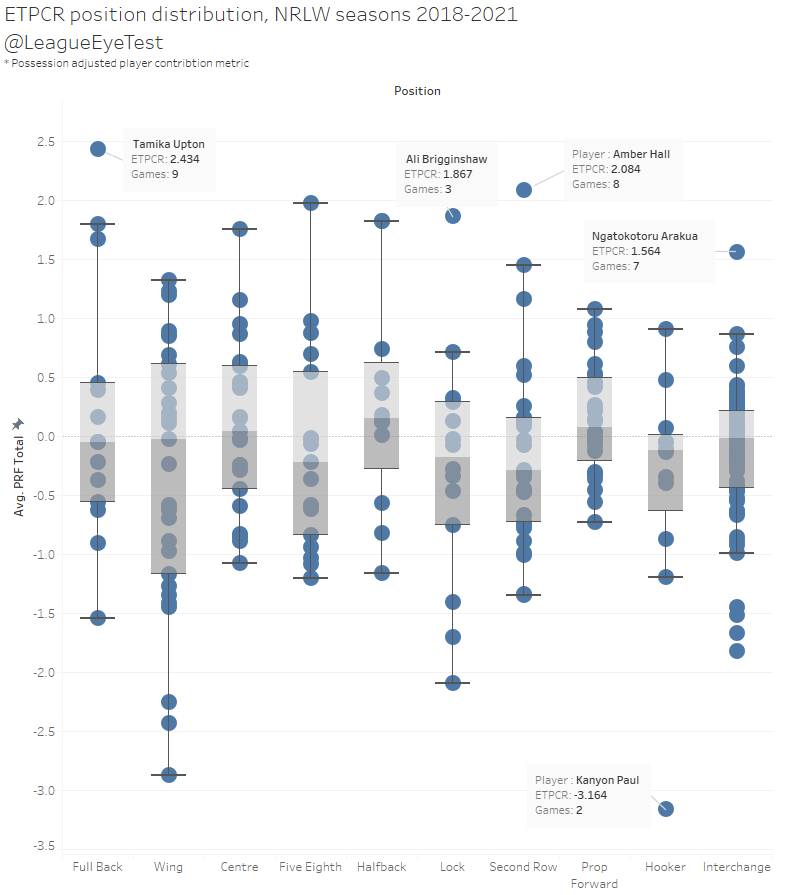
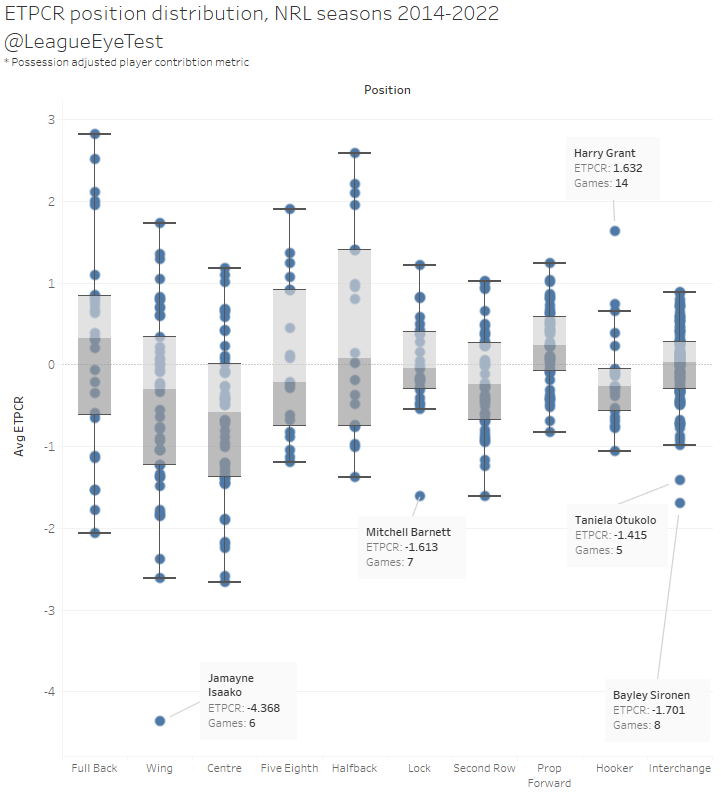
One thing that stands out is just how few negative outliers there are, but that does correlate well with the NRL. If we compare it to the same chart for the NRL there’s a few players sitting well outside the lower boundary of the whiskers, including Jamayne Isaako’s -4.368 in five games on the wing this season.
But for NRLW, the only non interchange player who sits outside the lower quartile was Kanyon Paul’s two games at hooker in 2020.
However, unlike the NRL there’s a few players who are obviously positive outliers, and like the men’s game these names shouldn’t be that surprising. At fullback it’s Tamika Upton, lock is Ali Brigginshaw, second row is Amber Hall and off the interchange bench it’s Ngatokatoru Arakua.
Even in the extremely cooked 2021 season there were only two huge positive outliers – Tom Trbojevic and Nathan Cleary. In 2022 there’s just one – Harry Grant – which speaks more to how impressive the Storm dummy half is and ETPCR’s inability to accurately quantify a hooker’s contribution.
Even if you look inside the box and whisker plot to players only inside the whiskers, there’s still some large gaps between the upper extreme and the middle quartiles and medians. This would make sense in a relatively new six team competition with a limited number of elite players.
Kimiora Breayley-Nati at +1.974 is streets ahead of the next best NRLW five eighth, Emily Curtain ant +0.979.
Tarryn Aitken’s 1.826 and Ali Brigginshaw’s +1.821 places them significantly ahead of their nearest competition at halfback, Zahara Temara at +0.744.
For centres, Evania Pelite at +1.755 is over half a point ahead of the second best NRLW centre by ETPCR, Shenae Ciesiolka at +1.153.
Fullback is the same story – Chelsea Baker (+1.797) and Emma Tonegato (+1.669), along with Upton are the only fullbacks since 2018 that sit above the median fullback ETPCR of -0.049.
You’re probably getting the point here, and it’s not surprising given how long the competition has been around. As noted above, there’s a larger gap between the elite and the very good in the women’s game, but hopefully we’ll see that narrow as pathways improve and the competition moves towards the full professionalism that it deserves. However, this indicates it’s likley that the 2023 season will be a struggle for some teams as these important skill positions take longer develop.
Another way to see how they diverge is by player averages at each position, not just the distribution. Checking the average by position allows us to understand what “good” might be for each player. For clarification, whilst 0.0 is “average”, that’s a league wide average across all positions. I’ve used this approach to make comparisons across positions valid, even if it’s a something I’d rarely do.
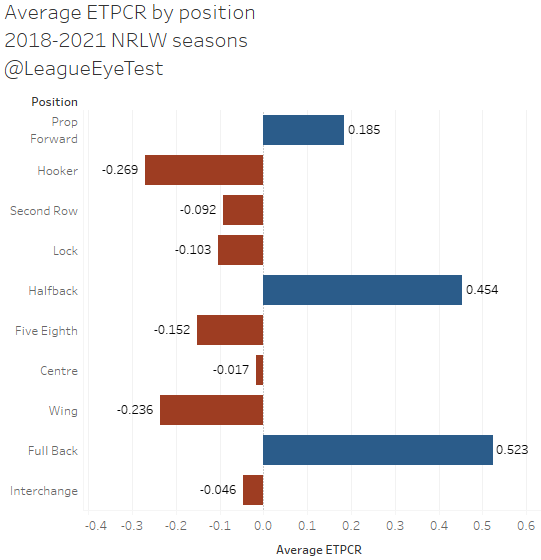
Below is the NRLW ETPCR average by position, where only three positions have an average ETPCR that is net positive, although two others (centre and interchange) aren’t far off.
And here’s the NRL one with five positions as a net positive and one more (interchagne) slightly underneath.
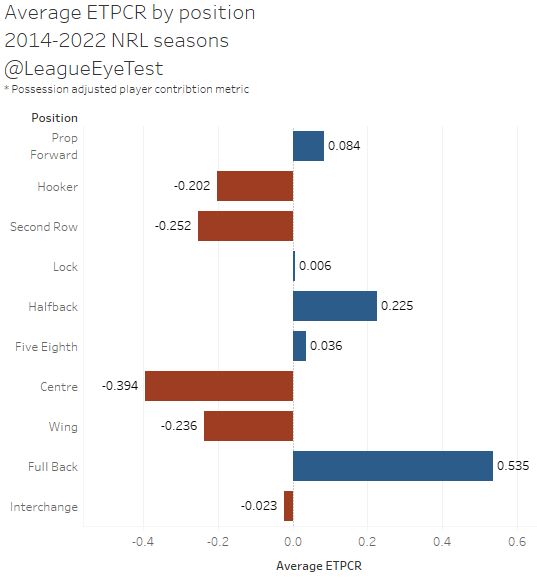
The similarities are that props, fullbacks and halfbacks are dominant across both competitions. But there are some differences.
Centres are almost a net positive position for NRLW at -0.017, whilst they’re the lowest performing position for the men’s game at -0.394 as teams look to exploit weak edges. From the limited data I’ve been looking at for NRLW, I’d posit that most successful attacks come from exploiting tired forwards through the middle of the field than NRL, which is more homogenised and built around targeting weak defenders on each edge. If anyone wants to donate some location data to test this theory, I’d very much appreciate it.
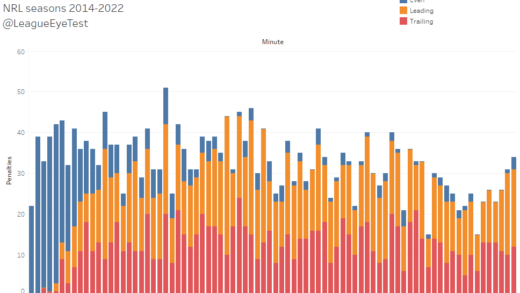
In lieu of that, I’ve looked at what positions are conceding line break causes and try causes. For NRL games from 2014-2022, 19.5% of try causes and 19.1% of line break causes come from centers, and wingers account for 22.4% of line breaks and 24% of tries. Next up is second rowers contributing 11.8% of line break causes and 9.6% of try causes, followed by interchange players who concede 10.7% of line break causes and and 8.6% of try casues.
For NRLW, those numbers are more muted for edge players with no player over 20% in either category. Wingers still have the highest percentage of line break causes at 18.2% and try causes at 19.5%, and for centres the numbers are 16.8% and 17.2% respectively.
The big difference is interchange players, who allow 12.7% of line breaks and 11.0% of try causes. Locks are also higher in the women’s game than the men’s, at 6.3% for line break causes and 5.2% for try causes for NRLW, compared to 4.0% and 3.2% for the NRL. This would indicate that a higher share of breaks are occuring through the middle from tired forwards, or players who are struggling to defend their bigger or faster opponents in the centre of the field.
Halfbacks are more dominant in the women’s game and their halves partners are a net negative on average, with five eighth’s ETPCR sitting at -0.152. Again this makes sense with the relative newness of the competition and half positions typically taking longer to develop, you would expect to see each team have a more dominant half than the left/right split the men’s game is built on these days. It also means, as we saw above from the numbers that even just having a dominant half is a key point of difference.
Similarly, locks are an integral part of an NRL structure and their importance shows at +0.006 for ETPCR, whilst in the women’s game it they’re more of a liability with an average ETPCR of -0.103.
One place where there’s no difference is for wingers, who sit at -0.236 for both competitions. Random number theory or the signs of an excellent model? It’s probably the former and let’s get into some reasons why.
Limitations in using the NRL model for NRLW
There are a few limitations in applying ETPCR to NRLW. The first is the sample size of games. Even including finals games there’s only been 39 total NRLW games since it began in 2018, and 18 of those came with the 2021 season earlier this year. With such a small sample size the margin of error can be quite large, and I’d need to be constantly updating the model to accommodate for new
I’ve used over 1500 games across eight seasons to create the model for ETPCR for NRL games, and I’ve not included finals games in that data set to train the model. The larger sample size smooths out any noise and is more reliable.
With that in mind, I’ve taken the somewhat heroic assumption that whatever correlation between margin and statistical production exists for NRL games also exists for NRLW games. It doesn’t, but it’s an easier (and quicker) option for now, rather than creating a new model on limited sample sizes and constantly training and correcting it with new data points as the season progresses.
The other issue with using the 39 game NRLW set is that some of the games were played under 60 minutes and some under 70 minutes. For the end output that isn’t as much of an issue as I’m adjusting for minutes played on the average for each season, meaning someone playing 80% of minutes in 2018 is equivalent to 80% of minutes in 2021. I’m also adjusting based on the number of play the balls per game, which is another way of normalising the data across seasons with different durations.
But it does create some questions about accuracy. Fatigue is an issue and what a player statistically achieved in a 60 minute game doesn’t necessarily scale linearly to a 70 minute game. Again, this will be solved in a few seasons with more games (especially those at 70 minutes), but is another reason why I’m using the NRL model until there’s a robust sample size.
A back of the napkin calculation would probably put the end of the 2023 season with the increase to 10 teams and nearly 100 games as a good starting point for developing an NRLW only model.
If you enjoyed this post please consider supporting The Rugby League Eye Test through one of the links below.
Scan the QR code or copy the address below into your wallet to send some Bitcoin to support the site Scan the QR code or copy the address below into your wallet to send some Ethereum to support the site Scan the QR code or copy the address below into your wallet to send some Litecoin to support the site Scan the QR code or copy the address below into your wallet to send some Bitcoin cash to support the site Select a wallet to accept donation in ETH BNB BUSD etc.. Donate To Address
 Donate Via Wallets Bitcoin
 Ethereum
 Litecoin
 Bitcoin cash
Support The Rugby League Eye Test
Support The Rugby League Eye Test
Support The Rugby League Eye Test
Support The Rugby League Eye Test
Donate Via Wallets