Last weekend’s fiery Souths/Roosters clash seemed to strike a line through the Rabbitohs chances as a grand final outsider with the lengthy suspension (but not send off) of Latrell Mitchell. Parramatta meanwhile performed one of the cruelest acts that could be inflicted on an already traumatised fanbase – they gave them hope.
Here at the Eye Test, we’d already struck a line through Eels for being perennial finals disappointments, Souths due to their defense, the latter of which I’ll expand on this later. Most teams had a line put through them by myself this season, and not just because they’ve had 50 points put on them. One team that hasn’t been completely eliminated from contention in my view (yet) is Manly.
Why Manly? I’ll get to that later but let’s first set the stage for how obscene this season has been for the top teams.
The first chart this week is a plot of average points scored and conceded for all NRL era teams (1998 onwards), with 2021 seasons highlighted in red. Credit to friend of the site Rugby League Analytics who had the idea for this chart first, showing results for English teams.
The chart is set up into four quadrants to group teams, defined by the average points scored in a game this season (21.4). The top left “bad defense/bad attack”, the top right “good attack/bad defense”, the bottom left “bad defense/good attack” and finally the bottom right showing “good defense/good attack”.
If you’re scoring above 21.4 per game and conceding less than that, you’re in the “good attack/good defense quadrant”. If you’re scoring more than 21.4, but also conceding more, then you’re in the “bad defense/good attack” quadrant. It’s a quick way of visualising what the basic strengths and weaknesses are for teams and seeing how they compare historically.
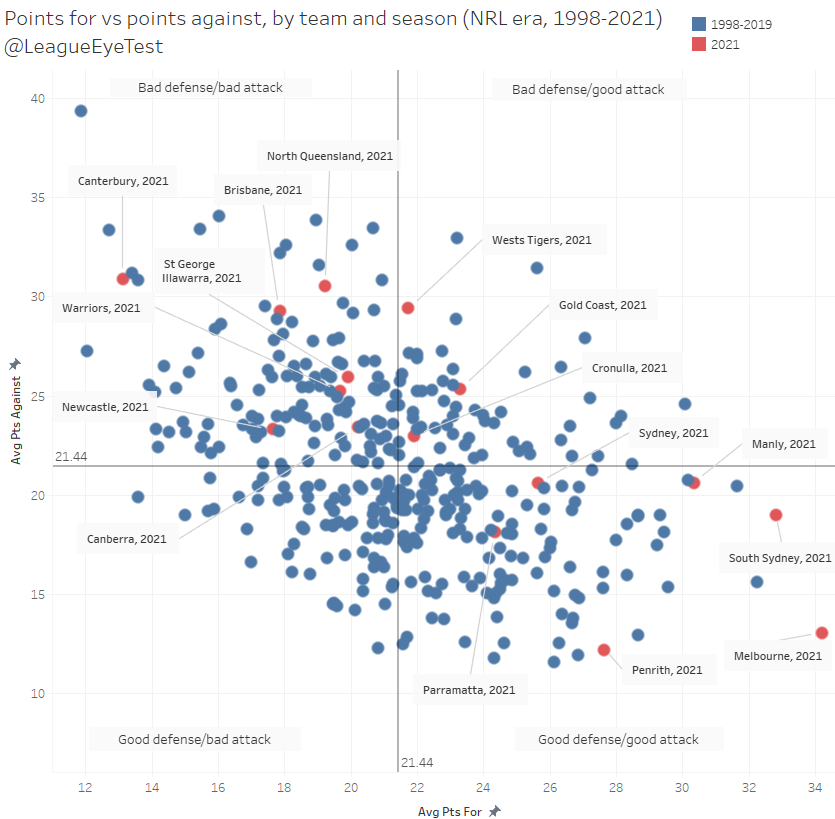
Looking at this year’s numbers, it’s painfully obvious just how ridiculous this season has been. Not only is Penrith historically great defensively, Souths have the second highest points for average since 1998 and Manly have the fifth. This doesn’t even count Melbourne averaging 2 points per game higher than the previous best mark for attack and sitting as an incredible outlier.
Those of you noticing where Manly is will be wondering why I haven’t ruled them out if I’ve ruled out Souths, who sit in a better position. The answer lies if I filter the same chart for Rounds 6-24, instead of the whole season, as seen below with the current season shown in red.
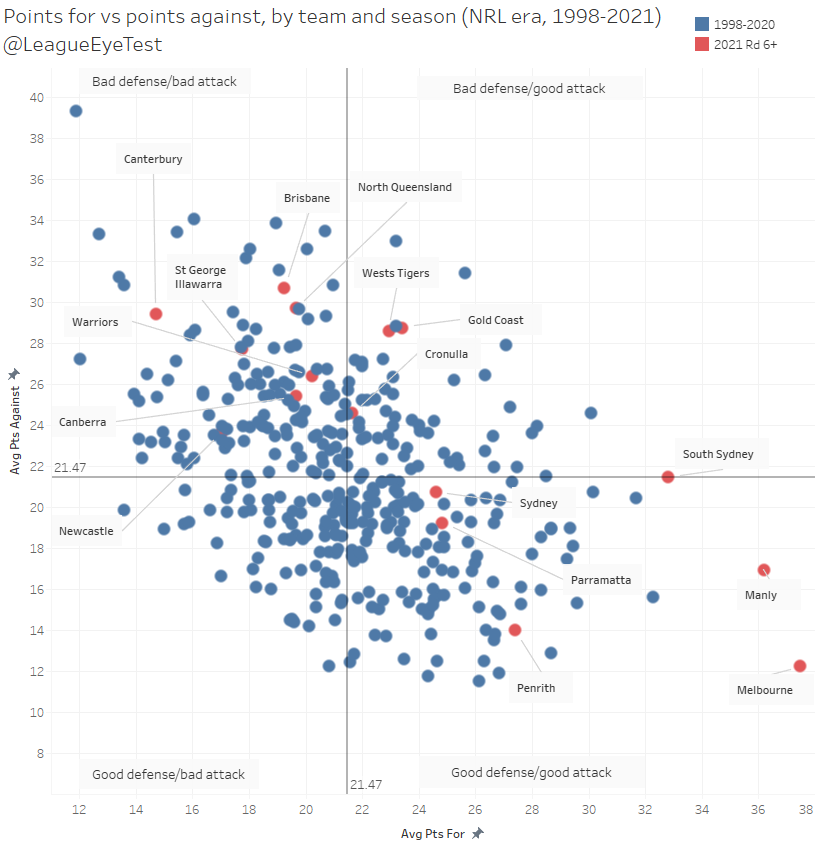
When looking post Round 6, Souths become an average defensive team despite putting a lot of points on the board. Last year I posted a similar piece showing that teams outside the “good defense/good attack” quadrant rarely make the grand final let alone win it, which is why I’d be putting a line through Souths after looking at this. On their best day they can put points on anyone, even without Mitchell. But they’ve shown this season that keeping teams from scoring hasn’t been their forte, which will become a larger issue in September.
Secondly, it’s no surprise that Melbourne are again a staggering outlier, even more so than on the previous chart, outscoring opponents 3 to 1 during this period. I feel like sometimes we almost take it for granted how dominant Melbourne are, this chart does a great job at highlighting just how far ahead of everyone else they are.
And then there’s Manly. For as dominant as Melbourne has been, the Sea Eagles are right up there over this period. It’s been obvious how easily the Sea Eagles have been scoring points Round 6 when Tom Trbojevic returned and other changes were made (Haumole Olakau’atu playing his first game of the season for example), but not a lot of focus has been on how difficult they’ve been to score on.
From Round 6, Manly has scored 36.2 points per game but only conceded 16.9, third in the competition behind the Storm and Panthers. It’s incredible to see the turnaround one player can make, but it would be disrespectful to ignore the job Des Hasler has done with what many considered a team lacking talent.
It’s an indication (from my perspective at least) that it took Hasler just over a month that the new “normal” in the NRL required some changes to his game plan, something that other coaches seem reluctant to admit.
Using one of my favourite charts, If you compare margin versus net set restarts (awarded minus conceded) over the same rounds, you’ll see that Melbourne and Manly are playing the same game and everyone else is lagging behind.

Another thing to note from the previous chart is that there’s no team sitting in the “good defense/bad attack” quadrant this season and three teams in the “bad defense/good attack” quadrant. One of the teams in that latter quadrant, the Wests Tigers, are having the third worst defensive season of any team scoring above league average, only behind the 2003/2004 Manly sides.
I know what you’re thinking – all perfectly normal.
It’s still hard to talk myself into anyone other than Melbourne or Penrith playing on the last Sunday in whatever month the grand final is played in due to Covid. But if I had to put money on one other team to be there it would be the Sea Eagles, as they’re the only other team that seems to understand just how much rugby league has changed this season.
Having the most impactful player in the game on your team doesn’t hurt either.
The worst defensive top 8 team ever?
Another way of segmenting the above for and against data is by highlighting the teams that make the top 8. The results are below, and for Newcastle fans it’s not pretty.
The Knights will join an illustrious group after this round, being just the fourth team in the NRL era to make the top eight from the dreaded “bad defense/bad attack” quadrant. They’ll join the 2002 Raiders, 2009 Broncos and 2008 Warriors once this round concludes, as Newcastle’s average scored (17.65) and average conceded (23.3) can’t be improved enough to jump into a better quadrant.
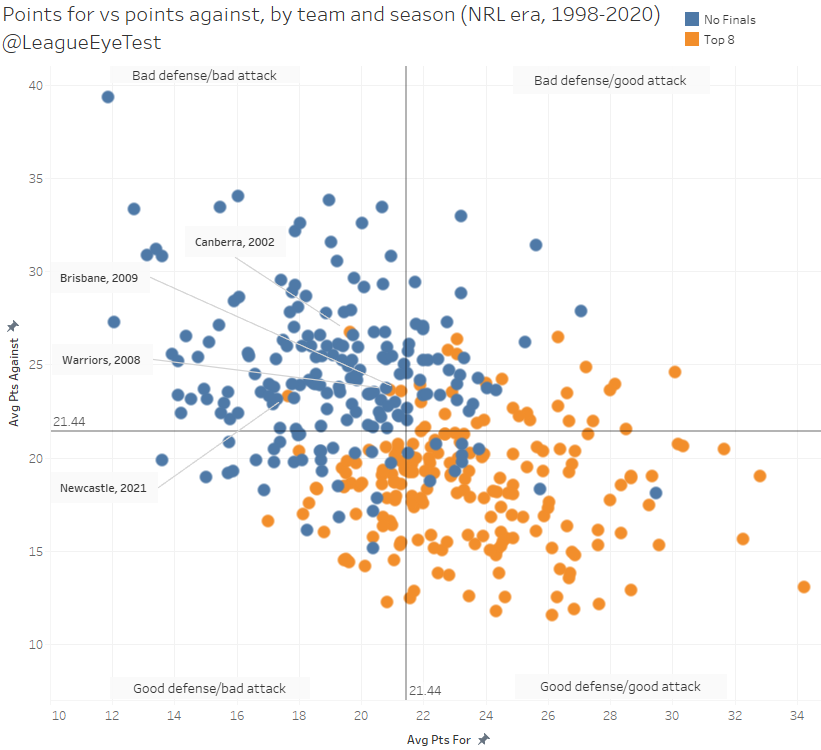
Newcastle is also by far the worst defensive team (by average points conceded) to make the top 8 during the NRL era. And they’re sitting in comfortably in seventh place.
Again, all perfectly normal stuff.
The biggest edge black hole in the NRL?
Last season I did some analysis on which edge players were the biggest black holes. I looked at which second rowers and centres were running the ball the most and passing the least, to identify which players were tucking the ball and running rather than spreading it to their outside men.
The reason for this was watching Euan Aitken play, then at the Dragons, and his incredible ability to ignore his outside man and run the ball himself. And no surprises, he was the biggest black hole in the NRL last season.
Fast forward to 2021, and friend of the site Jason Oliver of the essential Rugby League Writers noted that Aitken hadn’t thrown a pass in three weeks.
That might be more palatable as an edge backrower this season at the Warriors than it was as a centre at the Dragons previously, but it still starves the outside backs of opportunities to attack.
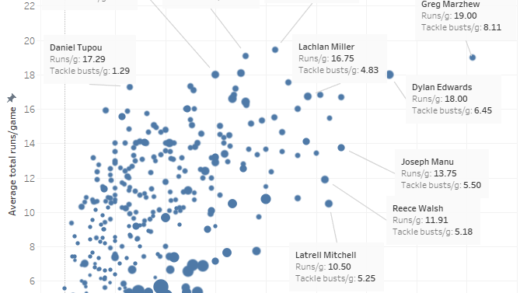
Given this observation, I thought it was a great time to revisit this and the results for 2021 are below. Data is from players starting a game as a second rower or centre, and not from those as an interchange player but playing there. Average number of runs is plotted against average number of general play passes, with number of possessions indicated by the size of the data point.
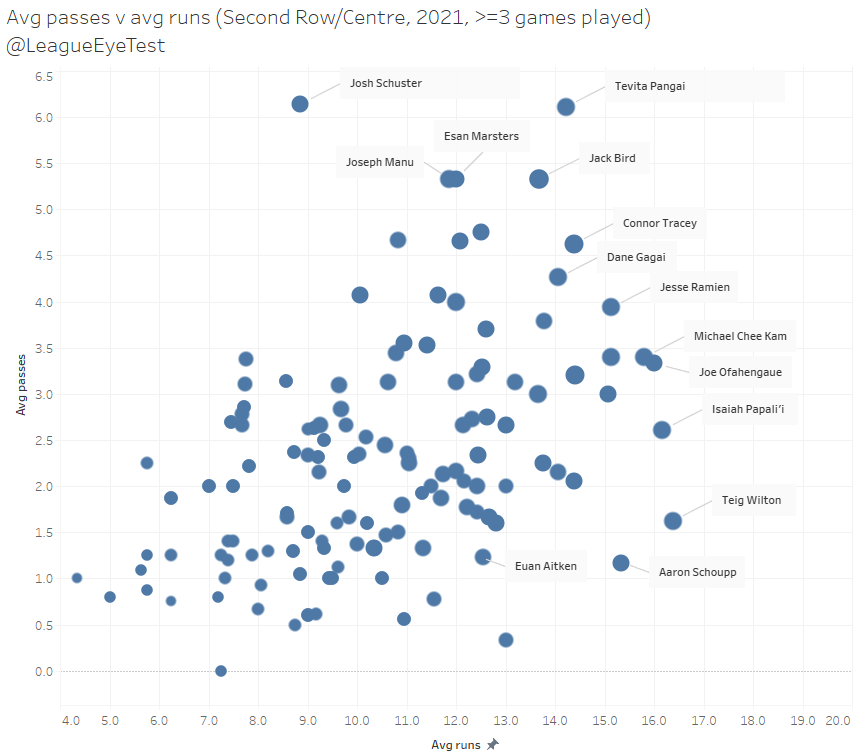
For the Aitken fans, you’ll be pleased to hear he’s not the worst offender this season. He’s still not passing the ball much but he’s not running it as much either. The largest black hole honour in 2021 would go to the Sharks Teig Wilton, who averaged 16.4 runs per game and just 1.4 general play passes in his eight games in that position this season. He’s slightly ahead of the improved Isaiah Papali’i from the Eels, who runs the ball 16.2 times per game but passes nearly twice as often as Wilton at 2.6 per match.
The Bulldogs Aaron Schoupp is by far the worst offender at centre, averaging 15.3 runs per game but only 1.2 general play passes. Cronulla’s Jesse Ramien has a similar number of runs but passes the ball nearly 4 times per game.
On the other end of the scale, the most prolific passers this season from an edge player have been Josh Schuster (6.1 general play passes with 8.9 runs per game) and Tevita Pangai at the Broncos (14.2 runs with 6.1 passes).
If you enjoyed this post please consider supporting The Rugby League Eye Test through one of the links below.
Scan the QR code or copy the address below into your wallet to send some Bitcoin to support the site Scan the QR code or copy the address below into your wallet to send some Ethereum to support the site Scan the QR code or copy the address below into your wallet to send some Litecoin to support the site Scan the QR code or copy the address below into your wallet to send some Bitcoin cash to support the site Select a wallet to accept donation in ETH BNB BUSD etc.. Donate To Address
 Donate Via Wallets Bitcoin
 Ethereum
 Litecoin
 Bitcoin cash
Support The Rugby League Eye Test
Support The Rugby League Eye Test
Support The Rugby League Eye Test
Support The Rugby League Eye Test
Donate Via Wallets