The NRLW regular season has wrapped up and with finals starting this weekend we can look back at the season as a whole and see if there’s any takeaways from the Eye Test’s efficiency analysis for the whole 2023 season.
If you’re new to the site, to examine team efficiency in attack and defense we look at how each club has performed under the site’s expected point model (ETxP), and compare those expected outcomes to their actual on field performances.
Teams that score more points than their field position would typically yield are deemed more efficient, and those that give up more points than their opponents field position usually would are deemed inefficient.
Before we go on, once again I’m late with my NRLW post this week and I’d like to apologise. Real life has unfortunately gotten in the way. It’s becoming pretty clear that with my current schedule and responsibilities, something will have to change with the Eye Test for 2024 if it’s to remain sustainable for the future.
On to the analysis. As usual we set the scene with a chart looking at actual points scored and conceded to frame on field performance.

Anyone even casually following the NRLW this year wouldn’t be surprised here. The Eels and Cowboys are horrendous defensively, and the Tigers, Raiders and Dragons all sitting mid pack. 6th placed Cronulla fall in line more with the top four than the rest, but some of that was padded by a historic walloping of the Eels.
It’s also clear to see why the top four are the top four. Three of them have excelled at protecting their own line this season, with the Titans, Roosters and Knights all conceding 14 points or fewer per game. Brisbane is an outlier in that they allow more than 18 per game, but their potency with the ball has kept them alive, posting 28+ points per contest.
Now let’s check out the average expected point gained and conceded per team for the season.
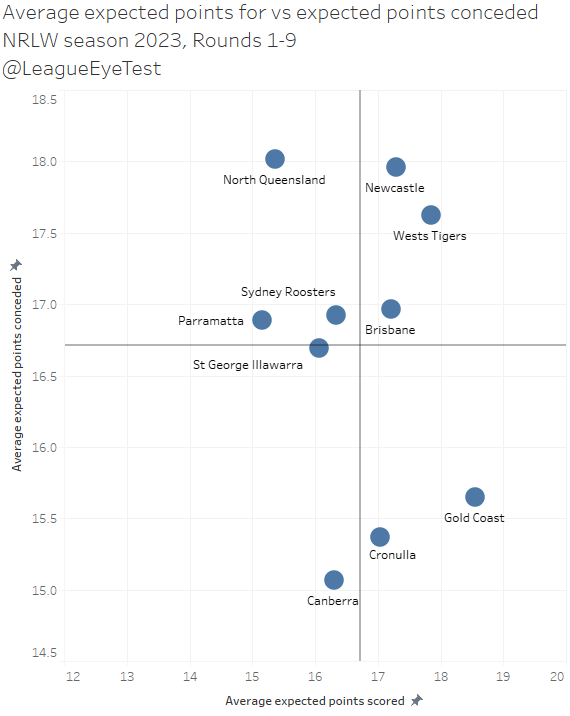
The thing that differs here for NRLW teams compared to their NRLM is that the range of expected points scored and conceded per game is very small. Less than 4 expected points per game scored separates the 1st (Gold Coast) and 10th teams (Parramatta), and there is just over 3 expected points between first (Canberra) and last (North Queensland) in defense.
Let’s compare expected points scored with actual points scored.
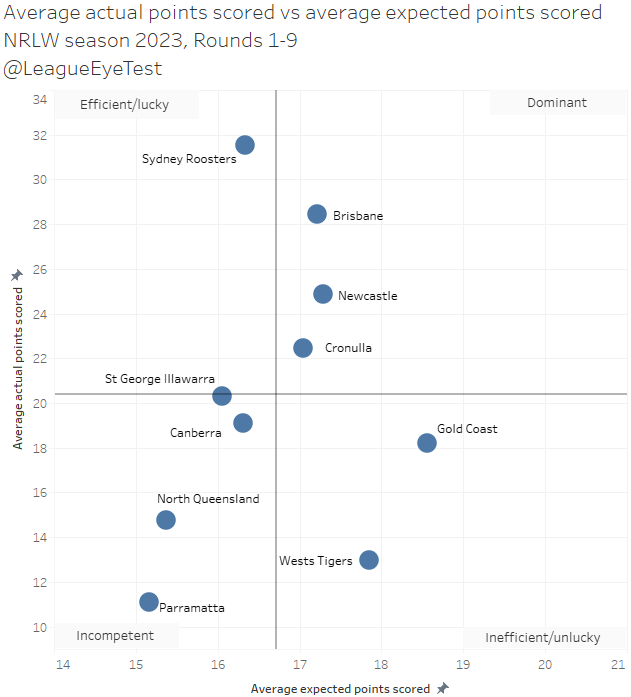
The Roosters end up as the only “efficient/lucky” team in the competition, which is a result of there point scoring coming from lower expected point value possession. Brisbane and Newcastle sit in the “dominant” quarter, as do the Sharks but again they’re boosted by that Eels game.
The Titans are still an inefficient team with the ball, something I noted a month ago. The fact they’ve made the finals is more of a testament to their defense as we’ll see shortly. But if they can manage to string together some good games with the ball, they’re still the best bet for breaking up the Roosters/Knights duopoly.
And the less said about Parramatta and North Queensland here the better.
Moving on to expected points conceded versus actual points allowed.

Here is where the Titan’s strength lies. Not only do they allow one of the lowest actual points per game in the NRLW (14.0/game), they also have the third lowest expected point average allowed at just 15.7. This indicates that they’re fantastic at restricting the field position of their adversaries, which is usually a good trait for teams looking to make a grand final. It’s something the Penrith Panthers have done for years in NRLM.
The other three top four teams all sit in the “efficient/lucky” quadrant, where they give up more than league average in expected points but concede fewer than league average. Newcastle specifically give up the second most expected points but the fewest actual points allowed.
That shows they can defend teams who accumulate a lot of high value possession, but come finals time it’s not a strategy that may pay off when you’re facing teams who know how to break down defenses.
Lastly we’ll simplify these charts by looking at the percentage points scored or conceded over or under expected. Firstly in attack, where higher is better.
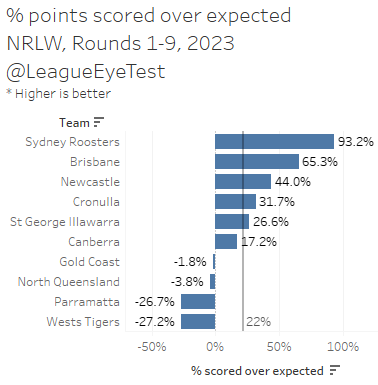
This really quantifies how strong the Roosters were in possession this year, scoring 93% more points than an average team would with the same field position or possession. Brisbane were second at 65%, with Newcastle third at +44%.
The Titans struggles are very clear here, scoring -1.8% fewer points than an average team would in the same situation.
And the Wests Tigers share something with their NRLM counterparts, placing last in the league by this metric at -27% under expected.
Looking at the same chart defensively shows a similar trend, but is more friendly for the Titans.
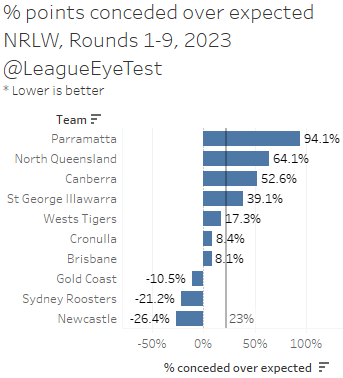
The Knights and Roosters still sit first and second here, both conceding 20% fewer points than an average team would facing the same opponent field position. The Titans are the only other team with a negative percentage here, at -10.5%.
It’s hard looking at these numbers and betting against a Sydney Roosters v Newcastle Knights grand final. It’s looked that way for most of the season and feels like an inevitability right now. Brisbane clearly has the attacking capability to put on points, but Newcastle has shown all season they can defend their line under a weight of possession.
And the Titans haven’t been able to execute with the ball when needed, something they cannot afford to get wrong against a deep side like the Roosters. The problem will be that in a low scoring game where both sides feel confident in their ability to defend their line, where are the Gold Coast going to get the points required?
The Gold Coast have benefited from being able to restrict the field position of their opponents this season, but that probably isn’t going to work on Sunday. Below is their heat map of opponent play the balls this season, where you can see there isn’t much high intensity spots near the try line except around the right post.
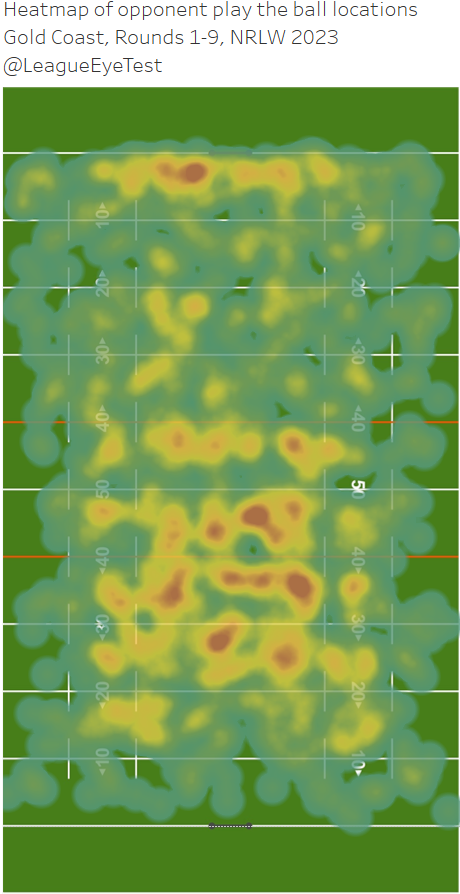
Note there is also a severe lack of play the balls between 10-40 metres from teams playing the Titans. Most play the balls are occurring at least 40 metres away and mostly in their opponents’ half.
Contrast that with the Sydney Roosters heat map of their own play the balls.

It shows how narrow their play the balls are as they move downfield, and quite a high intensity in front of the posts out to 10 metres from the line.
The Roosters have shown they can do it from all areas of the pitch, while the Titans consistently struggle to get the ball to the right players in the right situations.
The other story from these numbers for Parramatta and North Queensland also show why there needs to be at least another season before expansion. If there is not going to be an even talent distribution, some stability is needed to let the improving pathways catch up.
To finish up this week, heres’ the expected point charts and advanced stats from Round 9.
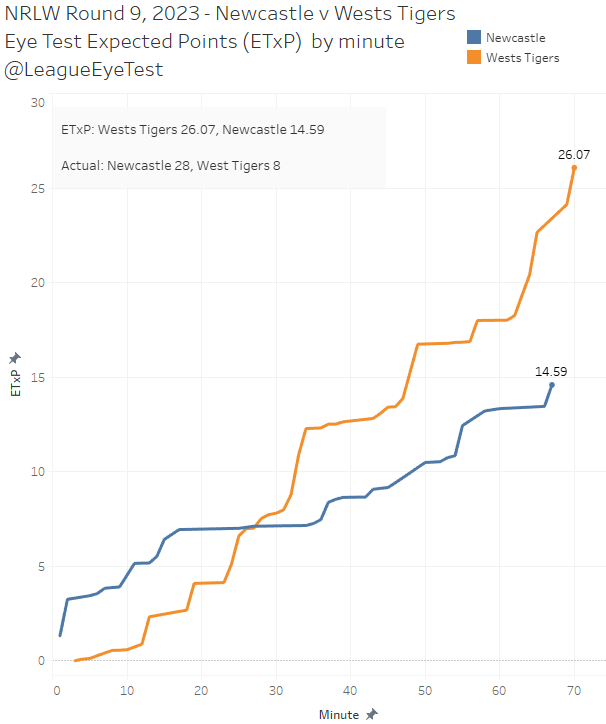
Newcastle v Wests Tigers
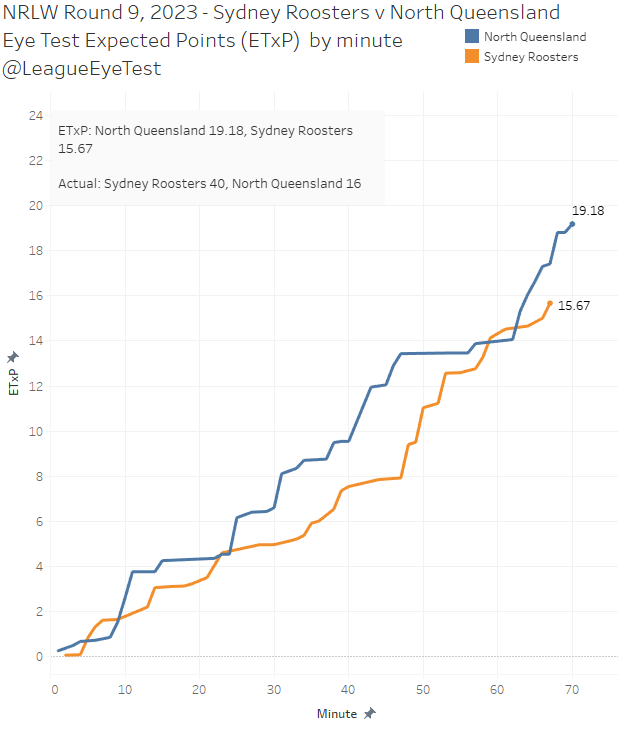
Sydney Roosters v North Queensland
Brisbane v St George Illawarra

Parramatta v Cronulla

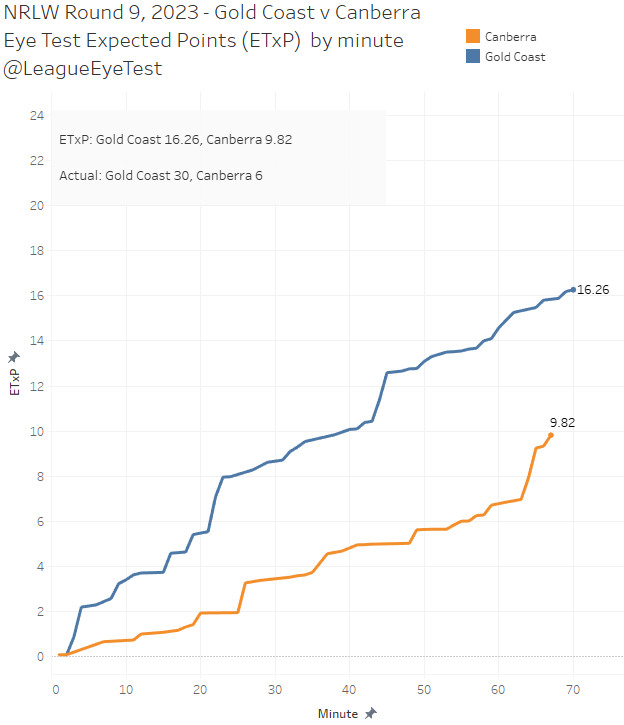
Canberra v Gold Coast
Eye Test Player Contribution Rating (ETPCR)
With a Round 9 ETPCR of +9.106, Cronulla centre Annessa Biddle now holds the highest single game ETPCR in NRLW history. The previous high was Tamika Upton in Round 1, 2020 with an ETPCR of +8.567.

Similarly, Shellie Long of the Cowboys now holds the single game lowest ETPCR with -11.160 in North Queensland’s loss to Brisbane. That beat out the previous low, held by her team mate Vitalina Naikore who posted an ETPCR of -9.269 in Round 3 this year.

Amelia Mafi’s -8.583 ranks fourth lowest all time, and I’m genuinely surprised that the Eels didn’t have a stranglehold on the bottom 10 spots. I guess the line causes and try causes were distributed evenly through the game, very polite of the Sharks to share the misery around rather than pick on one poor soul.
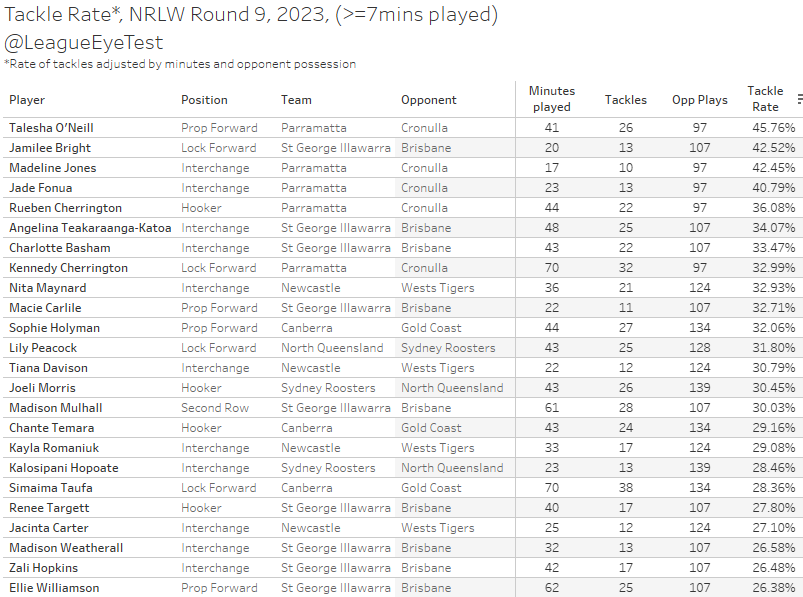
Tackle Rate
Ball Runner Rate

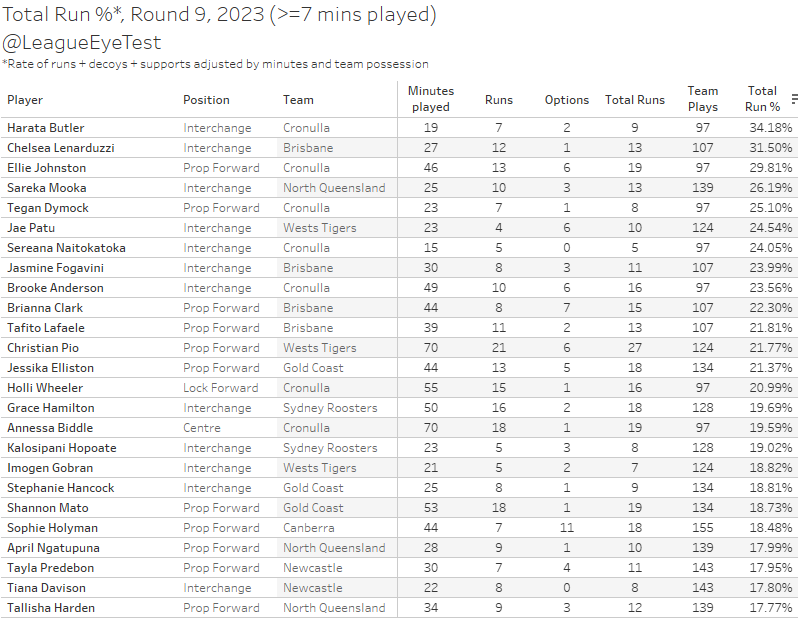
Total Run %
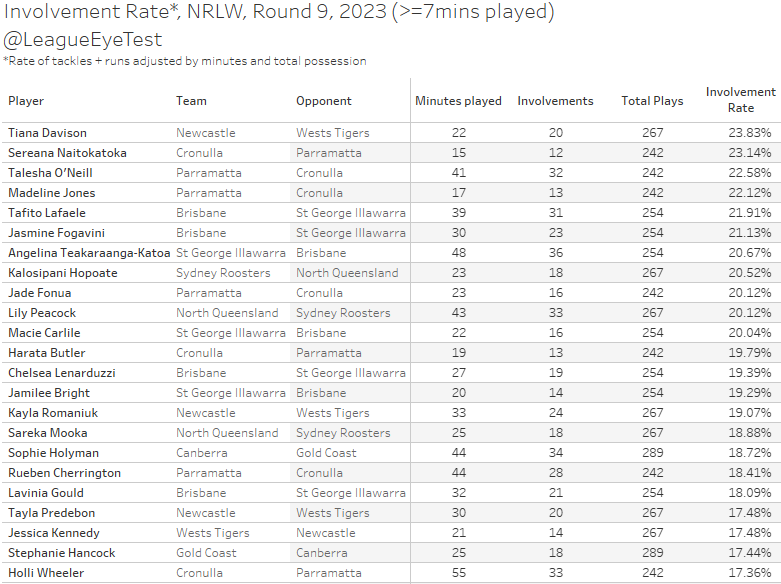
Involvement Rate