Just over a month ago I posted a thought experiment around using statistics, and most notably this site’s player attribution metric, to simulate a Dally M voting system and see who would come out on top as player of the year.
I tried a few methods, but most of them came out with similar results on top, and other than the distribution of forwards there weren’t any real glaring issues. You can catch up on it here, but I’m going to use one method from that post to check out the player and team of the year.
With the NRL’s Dally M award being presented on Wednesday evening, I thought it would be a good time to update the tally from Round 24 onward and see if the end result matches up with what we’ll see this week.
To do this, I’m going to use this sites player attribution metric, the Eye Test Player Contribution Rating (ETPCR), which weights player statistics based on how positively or negatively they correlate with winning matches. These the positive and negative weightings are added together, normalised for possessions and minutes played. They’re shown as a per game points gained or conceded per player. You can read more about ETPCR here in the lengthy explainer if you need more information.
The proxy Dally M method we’re going to use the 3-3-2-2-1-1 voting system I mentioned in the previous post. It works by taking the top three backs and top three forwards by ETPCR from every game this season. Then we rank them from 1-6 based on their ETPCR and award them 3-3-2-2-1-1 points from first to sixth.
This gives another level of understanding of which players are contributing more regularly tot their team, and not just those who have one or two big games that pushes up their season average. I’m also not taking into account suspensions, so everyone is eligible for this virtual Dally M equivalent.
It’s not a perfect system, but I don’t have two different metrics to simulate two judges. Using 6-5-4-3-2-1 seems like a better solution but it still undervalues forwards as things like tries, try assists and line breaks correlate highly with winning games which means forwards are going to be under represented. So I’ve used the 3-3-2-2-1-1 method to make slightly more even across positions.
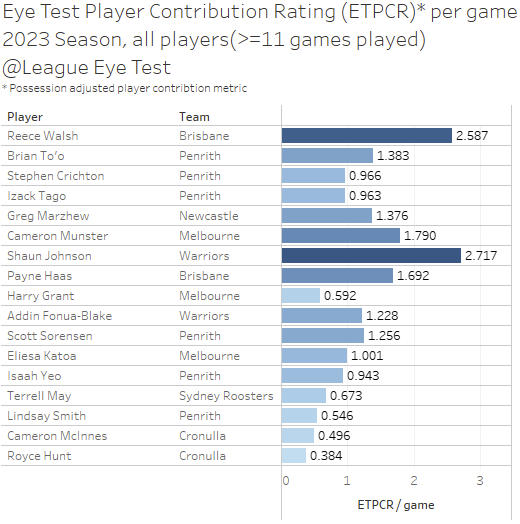
To set the scene, we’re going to show the top 20 players by the ETPCR metric for the season, to show the difference based on a pure average alone, which we revealed a few weeks back in the 2023 Advanced Statistics Leaders post.

There’s not a lot to add here that wasn’t mentioned in that post. Shaun Johnson squeaked by Nicho Hynes for top spot, with Reece Walsh, Nathan Cleary and Jahrome Hughes making up the top 5. Ponga would have played first if we’d limited this chart just the second half of the season, such was his domination post Round 12.
Now we’ve established who had the best overall season by this metric, now we can look at how this simulated voting system would look. Below are the top 20 players if we use the 3-3-2-2-1-1 Dally M style voting system for each game.
I let the cat out of the bag a few weeks back with my 2023 advanced statistics leaders post where I mentioned that Johnson would have won this. But regardless here’s the top 20 by this voting system after Round 27. (If the numbers look very slightly different comparing them to the previous post, I’d like to apologise because somehow Round 20 was missing from the previous analysis. Please understand).
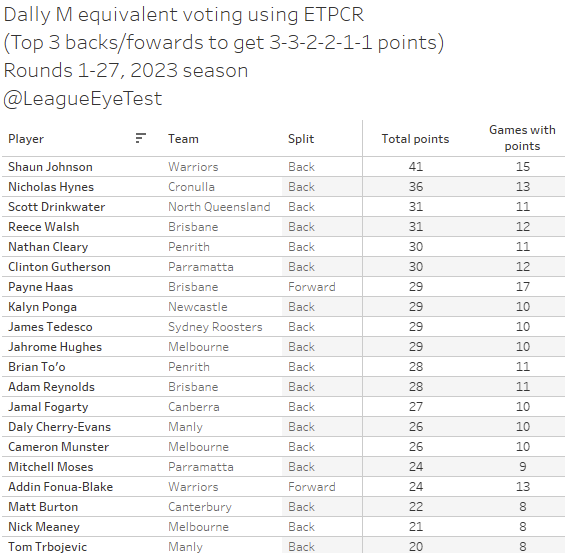
Johnson ended up with 41 points, with 15 games of his ranking in the top 3 for backs, and should be the firm favourite to win the Dally M award this year. He had an unassailable lead by this methodology before Round 26, so Hynes getting three “votes” in the final game of the season was meaningless to the end result. Reece Walsh and Scott Drinkwater tied for third place on 31 votes (or points), with Nathan Cleary and Clint Gutherson rounding out the top 6.
To show how consistent Johnson was, here is the breakdown of his positive and negative ETPCR components by round.

Other than Rounds 9, 13 and 18, he had an overall positive ETPCR for every other match this season. That’s why he polled votes in so many matches.
Ponga placed 7th and his position that high is incredible considering he only polled 3 points before Round 13. Every other vote was garnered in the second half of the season. Looking at his breakdown of positive and negative ETPCR shows just how dominant he was, and I’ve labelled every game where he had a positive ETPCR component above 3.

If he’d managed to stay on the field and play at fullback for the whole season he’d probably have taken top spot.
Payne Haas remained the top forward and ended up with 29 points, with 17 games getting at least one point or vote. That was the highest of any NRL player, Johnson was the only other player to place in the top three backs or forwards in more than 13 games. Again, we’re rewarding consistent great performances with this method.
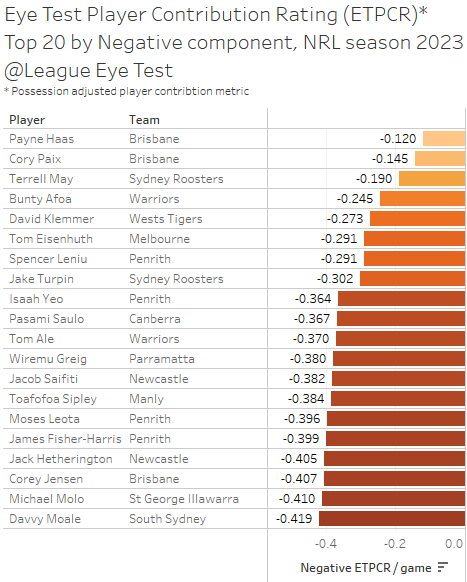
And as noted in the advanced stats recap of the season, Haas had the best negative component of a ETPCR score in the NRL, which is amazing considering the big minutes he played. It’s not a surprise he polled votes in so many games.
Going back to the voting table able, Addin Fonua-Blake was the only other forward inside the top 20 with 24 points with 13 appearances scoring points. Scott Sorensen, who placed inside the top 20 previously, ended up 24th due to missing some games at the back end of the season. David Fifita, Eliesa Katoa, Harry Grant and Pat Carrigan all placed inside the top 35, which is where the distribution of forwards starts to normalise after the glut of backs at the top.
Other than Matt Burton and to an extent Gutherson, which we’ll touch on a bit later, that feels like a good representation of the best players in the NRL this season.
Now if we were to put together a team of the year based on this voting, it would look like this. I’ve gone with Walsh over Drinkwater since although they tied in points accrued, Walsh scored points in 12 games to Drinkwater’s 11.
- Reece Walsh
- Brian To’o
- Campbell Graham
- Jesse Ramien
- Dominic Young
- Cameron Munster
- Shaun Johnson
- Payne Haas
- Harry Grant
- Addin Fonua-Blake
- Scott Sorensen
- David Fifita
- Pat Carrigan
That’s lineup to me feels somewhat reflective of the season, and other than Graham and Ramien there isn’t anyone there I’d accept serious complaints about. And those two appearing ahead of someone like Stephen Crichton comes down to the Panthers points being siphoned by Cleary, To’o, Luai and Edwards before him. Similar for Bradman Best, who would often be the 4th ranked Knight behind Ponga, Young and Greg Marzhew.
It’s just an inherent flaw of this style of voting, where being the 4th best player on the best team in the competition will see you rank behind players of lesser ability.
For me it will be interesting to see how these results stack up with the actual Dally M awards on Wednesday evening.
From the already revealed list, the most interesting name (other than last year’s winner Hynes not making the cut for halfback) is James Tedesco, who ranks 5th by both ETPCR season average and the simulated Dally M voting. Given Walsh and Drinkwater served suspensions, that’s most likely the reason for him finishing in the top three.
One the flip side, the two names from my simulated voting that isn’t in the NRL’s list is Sorensen and Ramien. Given the names that are in the NRL’s list, it’s not hard to see how they missed out but based on pure statistical output they’re in the same league as those named, if not ahead.
For comparison’s sake, here’s the team of the year purely by ETPCR.
One other thing I’ve done differently is to pick a full 17 with positions 14-17 being the top interchange players by ETPCR. And to determine someone as an interchange player, I’ve set their threshold at 9 games played from the bench.
Again I feel it’s a very representative team for 2023, with Eliesa Katoa probably the biggest outlier. But if you consider he played 21 games, scored 6 tries and broke the line 12 times, not that far behind Fifita’s output for the Titans, so it’s not that outlandish.
There’s are a few differences though. Ponga ends up in the #1 jersey as his season average was higher but he didn’t place in the top three backs for as many games as either Drinkwater or Walsh (or Gutherson for that matter).
To’o maintains his wing spot, but Young is replaced by team mate Marzhew. Again by this method you’ll rank higher having a few bigger games than consistently placing in the top three backs or forwards.
Two Panthers make up the centres here, with Crichton and Izack Tago sporting the two highest ETPCR season averages. Graham had an average of just +0.285 for his ETPCR this season, but because he had six games where he scored the maximum three points his performance under a Dally M style voting system paints him in a better light.
His ETPCR suffered because although he had some very big games (early in the season), South Sydney let in significantly more points during the second half of the season and Graham had some very low ETPCR numbers. It’s one of the few examples where a few big games favours any type of 3-2-1 system over a season long average.
The halves are exactly the same, as are the front rowers and hooker. Sorensen keeps one of the edge positions as well.
The last two differences are Katoa for David Fifita, which we’ve touched on before, and Isaah Yeo in for Pat Carrigan. There’s very little difference here, with Yeo’s +0.943 only slightly ahead of Carrigan at +0.808.
For bench specific players, we end up with Cam McInnes (whose 9 bench appearances all occurred prior to Round 22), Terrell May, Royce Hunt and Lindsay Smith. You might remember May from the negative ETPCR table above, where he had the third lowest average of any NRL player. On a side that loves to give away penalties and spend time in the sin bin, having a player like May who doesn’t make mistakes is vital.
Other than someone like Grant or Daniel Saifiti having handful of good games off the bench, these four were the most impactful regular bench players by ETPCR. It feels more organic to me than just putting the next four ranked forwards on the bench, interchange players have specific roles to play and we should be embracing them instead of having them make way for starting players.
The flaw with any variation of a 3-2-1 voting system also means that someone from a Dragons v Bulldogs game has to score points. That’s how Matt Burton ended up 18th in my Dally M style voting and Gutherson 6th. Someone from those games is going to get votes, and looking at the paucity of talent the Dogs back line had it’s no surprise Burton accumulated them so as often as he did. And outside of Mitchell Moses, Gutherson was the most consistent Eels back this season, so it’s not a surprise he polled so highly.
As noted the last time we did this, Lachlan Miller had 17 points up to Round 12 and is playing in England next season, some of these votes are not like the others. It’s not a perfect system.
Using ETPCR with a season long average means that those games are aggregated and even if you were the best player in a match, you might have been the 48th best player in the NRL that week.
In the end, the results show there’s validity in both systems. The Dally M style voting rewarding consistency more than using a season long average, which is prone to deviations from extreme highs and extreme lows. I don’t feel either approach is right or wrong, it just depends on what question you’re looking to answer.
Do you want to see who the most consistent players game to game are? Then a voting system is probably best. Or do you just want to see who was the best for the season as a whole? Then use their average number and don’t worry about specific game by game fluctuations. Both have their merits, they just need the right application.
Obviously if we’re trying to recreate the Dally M voting then you need a variant of a 3-2-1 system. On Wednesday evening we’ll see if this system gets a similar ranking order to the NRL’s judges.