Club football is done for the year, and just as we did for the NRLM we’re going to look at the NRLW advanced statistic leaders for 2023.
Unlike the NRLM version, I will be including the three finals games in these advanced statistics. The first reason is that nine games isn’t really a sufficient sample size to work with so extending that out where possible could be useful, although it won’t change anything for the bottom six teams. For NRLM, there’s no reason to include finals games as we already have a sample size of 24 games, and I don’t include anyone who has played less than half of them. For NRLW, I want to cast the net as wide as possible.
The second reason is to add in at least one more game against quality opposition for the top four sides. The Roosters barely got out of second gear in a number of their games this season, so including another game against a top four side helps normalise their ridiculous numbers.
Ideally I’d not like to include finals games and once the NRLW season gets into the 11-12 game range I envision that happening. Until then we’re not going to limit appearances to just those regular season games.
If you didn’t read the NRLM version from last month, I’d recommend going back and reading it to get an idea of what these statistics are about and who was leading them.
And like the NRLM post, I’m going to start with the average number of play the balls each team faced. This gives an idea of which teams are more likely to accumulate statistics as more possession means more chances to fill up each categorical bucket.

The big difference here from the NRLM chart that Penrith dominated is that there was no real runaway side in terms of possession. The Gold Coast averaged 125 play the balls per contest, first in the NRL but that was only five per game more than the Sharks in second. And Cronulla didn’t even make the finals.
The gap from first to last was less than 20 play the balls, unlike the NRLM where the delta was 30. The high scoring Roosters only averaged 118 themselves, although you can’t play the ball if you’re converting a try every few minutes.
WIth that, let’s get on to the leaders.
Eye Test Player Contribution Rate (ETPCR)
First up we’re going to look at the sites player attribution metric, the Eye Test Player Contribution Rating (ETPCR), which assigns a weighting for statistics that correlate well with winning and positive margins (eg tries, try assists, line breaks, tackle busts, run metres) and also those that correlate with losing and negative margins (eg errors, penalties conceded, missed tackles, causing a try or line break).
Then we apply those weightings to each player’s statistical output for a game and adjust it for possession and you’ve got an estimate of how many points (positive or negative) that player was “worth” for that game. Add them together and you’ve got their season value.
Below is the top 20 players from this NRLW season, with a minimum of four games played (since it’s a 9 game season 4.5 is the midway point).

Sydney Roosters centre Jessica Sergis ranked first in the NRLW this season with an ETPCR of +3.682 per game, indicating she was adding that number of points to the Roosters each match. If she had been fit to play in the Roosters final against the Titans it may have been a different result, although her ETPCR is probably boosted by playing in a side that continually lapped their opponents.
The only other player this season above +3 per game was the Knights Tamika Upton at +3.223. She was instrumental in their semi final win over Brisbane, with an ETPCR of +6.675 in that game, and followed it up with a +3.158 in the grand final. It’s hard to argue that she wasn’t the best player in the competition all season.
A pair of Roosters took third and fourth spot, with Isabelle Kelly (+2.535) and Tarryn Aiken (+2.373) the only other players in the competition above +2 per contest. Jada Taylor from the Sharks rounded out the top five at +1.719.
Now here’s the bottom 20 players by ETPCR.
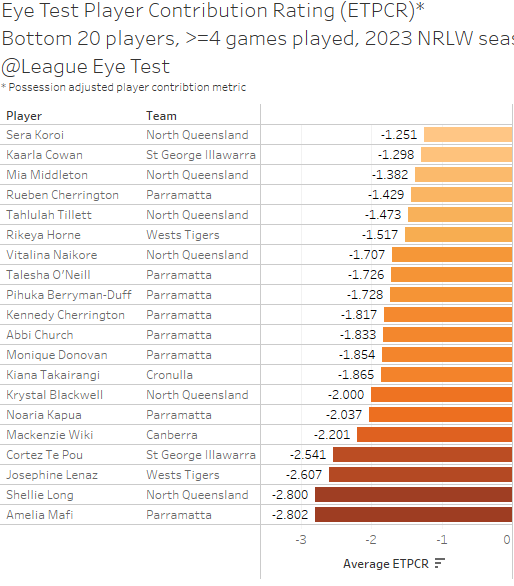
With a point difference of -206 across just 9 games, it’s not surprising to see so many Eels on this list, with Amelia Mafi sporting the lowest average ETPCR of the season at -2.802. Mafi just pipped North Queensland’s Shellie Long’s at 2.800 in an incredibly close race. Josephine Lenas from the Dragons took third spot with an ETPCR of -2.607 in her six games this season.
Error Rate
I’ve defined Error Rate as the average number of touches (or possessions/receipts, pick your own nomenclature) that occur for every error a player commits. I’ve set a different threshold here, mainly because players who regularly make errors generally don’t play a lot of football. Unless they’re a Dominic Young or Reese Walsh where their overall value outweighs a lost ball or an errant pass.
Here’s the 20 players with the worst error rates in the NRLW for 2023.

Wests Tigers’ Hope Tevaga had the worst hands in the NRLW this season, committing three errors in four games from just 12 touches of the ball. This comes out at a rate of one every four touches, which is probably from a small sample size more than anything.
Emily Bass from the Gold Coast placed second with an error every 5.7 touches and Cronulla’s Georgia Ravics was third, committing an error every 5.88 times she touched the ball.
The issue with error rate is that players who generally make a lot of errors but don’t contribute enough elsewhere usually don’t play many games.
All of the above players had less than 50 receipts of the ball this season, and if you look at players with a higher volume of touches then the rate is closer to 10 per error. Abigail Roache, Jakiya Whitfield and Shanice Parker all had double figure errors this season with over 100 touches.
Tackle Rate
This was one of the first advanced metrics for rugby league that the site used, and the easiest way of describing it is an estimation of how often a player completes a tackle, adjusted for possession and minutes played. Or tackles per minute adjusted for possession.
After all, you can’t complete a tackle if your opponent doesn’t have the ball. And if your opponent has the ball a lot, and runs in your direction, you’re going to make a lot of tackles.
I’ve set the threshold for these rate based metrics at 120 minutes, which is probably a bit high. The NRLM equivalent is set at 250 and they play about 2.5 times as many games and play 40 minute halves. Still I’ve gone with 120 minutes as it covers someone playing 4 games at an average of 30 minutes, which I roughly how I get to the NRL number (eight games of 30 minutes plus a bit extra). Like the games played threshold it’s a fluid and might change next year.
Here’s the top 20 for the 2023 season.
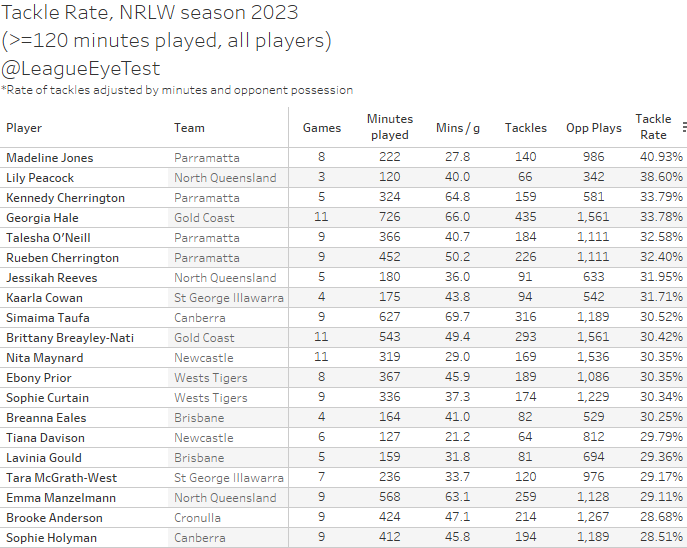
As we mentioned before, with the Eels having a disastrous record it’s not surprising to see them making tackles at such a high rate. Madeline Jones topped the NRL at 40.93%, indicating she completed a tackle on two out of every five play the balls she faced whilst on field.
Lily Peacock from the Cowboys was next at 38.60% with another Eel in Kennedy Cherrington right behind her at 33.79%. Behind the top three were Georgia Hale from the Gold Coast, and another pair of eels in Talesha O’Neill and Rueben Cherrington.
Ball Runner Rate
This measure is similar to tackle rate, but looks at how often a player completes a run with the ball, adjusted for minutes played and adjusted for possession. Keep in mind this is not a qualitative measure, just how often they make a run and not how useful that run is.
Here are the top 20 players for 2023.

Tafito Lafaele from the Broncos had the highest Ball Runner Rate this season at 21.57%. Sarah Togatuki of the Tigers placed second at 20.82% and was the only other player above 20%, which means they completed a run on one in every five play the balls whilst on field.
Lafaele’s teammate Chealsea Lenarduzzi took third place with a tackle rate of 19.84% for the season.
Special note should be made for Togatuki, Shannon Mato and Millie Boyle, all of whom placed inside the top 10 for run rate whilst playing 50 minutes per game or more. This is a contrast from the NRLM chart, where most of the top 20 players are playing less than half a game and it’s incredibly rare to see a player averaging more than 50 minutes a game with an elite run rate.
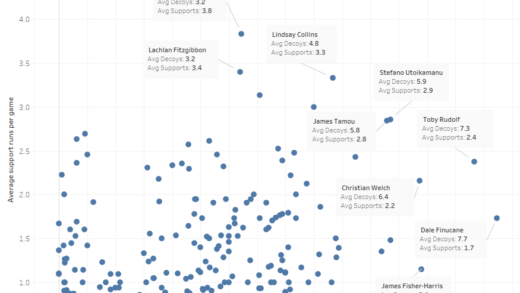
Total Run %
This builds on the Ball Runner Rate above, by adding in option runs – decoys or supports – to get a better picture of how often a player completes a run whilst on the field. The same adjustments (minutes played and possession ) are made here.
Below are the top 20 for 2023.

Once we add in option runs, Togatuki takes first place with a rate of 22.31%. Ellie Johnston from Cronulla moves into second spot at 20.82% with Shannon Mato coming in third at 20.52%.
Lenarduzzi (20.48%) and Boyle (19.43%) make up the top five, with no player averaging less than 37 minutes per game. Again, the NRLM chart is usually made up of low minute interchange players, not those playing 40 minutes or more per contest.
Involvement Rate
This last advanced statistic combines the running and tackling rates above to create an overall metric to measure the quantity of their workload. Like with the previous statistics, it’s purely quantitative, and as the great John Wooden said, “never mistake activity for achievement”. Although in most cases Involvement Rate usually matches the eye test.
Here are the top 20 for 2023.

Lafaele makes it a double here by taking out tackle rate and also topping the involvement rate chart at 24.92%. This means she completed a tackle or run on one in four play the balls whilst on field.
Second place went to the Eels’ Madeline Jones at 23.79% with the Dragons Tara McGrath-West running third at 23.02%. Togatuki and Newcastle’s Tiana Davidson rounded out the top five.