
With the 2021 regular season has drawing to a close it means we can take a look at who were the Eye Test’s advanced statistical leaders for the season. If you’re not aware of these advanced stats, I’d recommend a look at the glossary page for a quick rundown, and there’s further reading on Tackle %, Run % and Involvement Rate as well.
Before we start, I want to explain the minimum thresholds for these advanced statistics. For the first three (Tackle %, Run % and Involvement Rate) the cut off is having played 25% of games which is six appearances this season (last season it was five from a 20 game season). In addition to six games, there’s also a minimum 200 minutes played threshold to remove any players who have played enough games but not enough minutes to generate a decent sample size on the field.
By combining the games and minutes it eliminates players who don’t appear enough for decent sample size like Manly’s rookie Kurt De Luis who played the required 6 games but only 125 minutes (20.8/game) and I’d like to see a bigger sample size. It also removes players who may have played 200 plus minutes but in 4 or 5 games and had a few big games skew their data.
In the end the cut offs are mostly arbitrary however I feel they do a good job of recognizing the type of player these statistics were created to showcase.
For Net Points Responsible For (NPRF) and Error Rate the 25% cut off remains, however there is no minute restriction. In fact, NPRF only has the six game requirement, as low minute players don’t tend to feature. For Error rate, the only other minimum qualification is committing at least six errors. Again this number is subjective but passes the eye test for most cases.
If you’re curious as to what makes a good Tackle %, Run % or Involvement Rate, the average rates are shown below. Generally, they favour interchange middle forwards, but you do occasionally see some hookers and backrowers in the charts, although not typically for a full season.
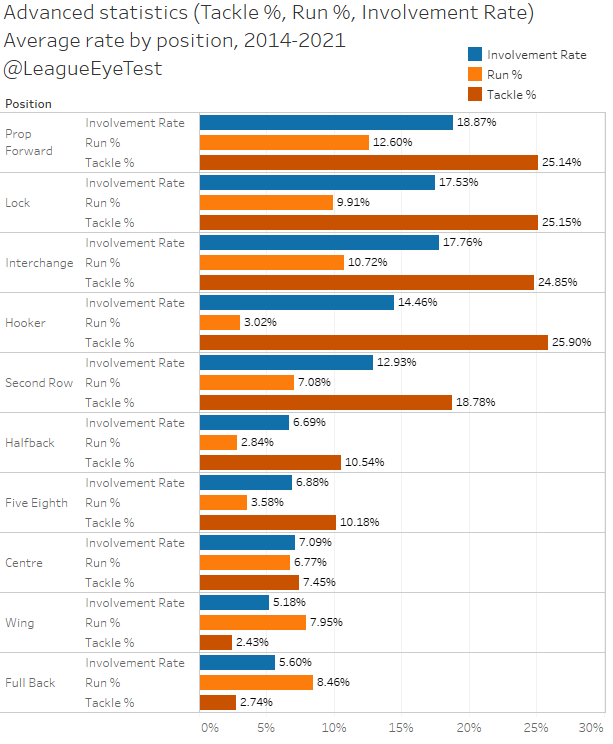
The leaders below are all significantly beating these averages, making them elite by these metrics. On to the 2021 leaders.
Tackle %
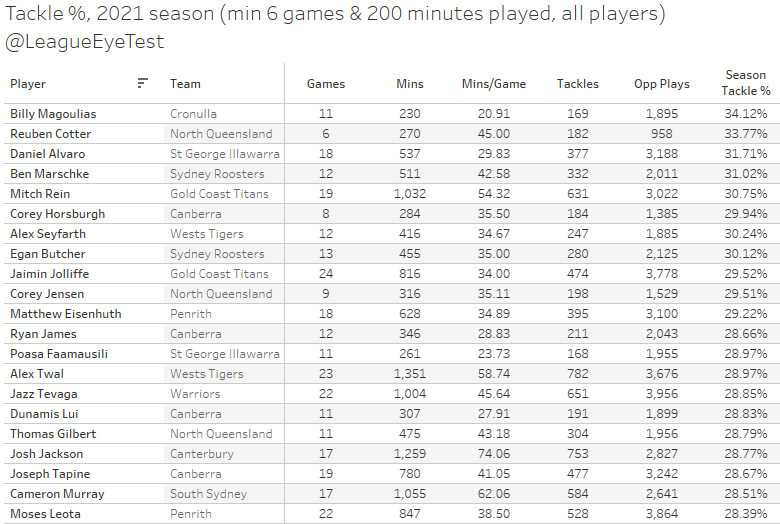
Billy Magoulias of the Sharks takes top spot for Tackle Rate in 2021 at 34.12%, meaning he is completing a tackle on at least three out of every play the balls Cronulla faces whilst he is on field. Second place goes to Reuben Cotter of the Cowboys at 33.77%, who may have taken top spot if he hadn’t spent the majority of the season out with a severe foot injury.
Rounding out the top three is Eye Test Hall of Famer Daniel Alvaro from the Dragons, with his usual high output at 31.43%. Alvaro would have taken the 2020 crown but only played 154 minutes during the season.
Previous winners:
2020 – Jai Whibread, Gold Coast (39.88%)
2019 – Daniel Alvaro, Parramatta (34.17%)
2018 – Daniel Alvaro, Parramatta (37.43%)
2017 – Daniel Alvaro, Parramatta (38.04%)
2016 – Siliva Havili, St George Illawarra (34.66%)
2015 – Christian Welch, Melbourne (42.88%)
2014 – Tim Robinson, Cronulla (36.65%)
Run %
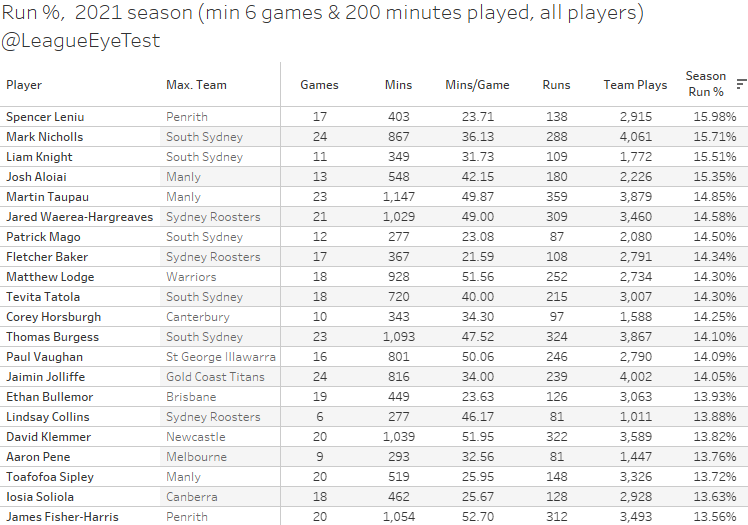
Panthers impact sub Spencer Leniu held on after blitzing this statistic at the start of the season, finishing with a run rate of 15.98%, and one of just four qualified players in the NRL who had a rate higher than 15%. A pair of South Sydney forwards picked up the second and third spots, with Mark Nicholls (15.71%) and Liam Knight (15.51%) following Leniu. The only other player above 15% was Manly’s Josh Aloai at 15.35%.
Previous winners:
2020 – Andrew Fifita, Cronulla (17.34%)
2019 – Corey Horsburgh, Canberra (16.09%)
2018 – Martin Taupau, Manly (16.29%)
2017 – Nathaniel Peteru, Gold Coast (18.77%)
2016 – Jeff Lima, Canberra (18.60%)
2015 – Paul Vaughan, Canberra (16.98%)
2014 – David Klemmer, Canterbury (18.49%)
Involvement Rate %

The number one player in the NRL this season for Involvement Rate was Canberra’s (by way of Belmore) Corey Horsburgh, who ended the season at 22.68%. This means he completed a tackle or run on more than one in five possessions during a game this season, one of just seventeen NRL players to have a rate higher than 20%.
Taking the runner up spot for a second time is Cotter, with an Involvement Rate of 22.37%. This place him ahead of third place in Tackle %, with Alvaro sitting at 22.30%. Last year’s winner, Jaimin Jolliffe followed up his impressive rookie season by playing 34 minutes a game in all 24 of the Titan’s contests and finished fifth for the season with a rate of 21.56%.
Previous winners:
2020 – Jaimin Jolliffe, Gold Coast (28.04%)
2019 – Daniel Alvaro, Parramatta (23.59%)
2018 – Daniel Alvaro, Parramatta (25.85%)
2017 – Daniel Alvaro, Parramatta (24.21%)
2016 – Siliva Havili, St George Illawarra (34.66%)
2015 – Christian Welch, Melbourne (25.27%)
2014 – Tim Robinson, Cronulla (24.07%)
Net Points Responsible For
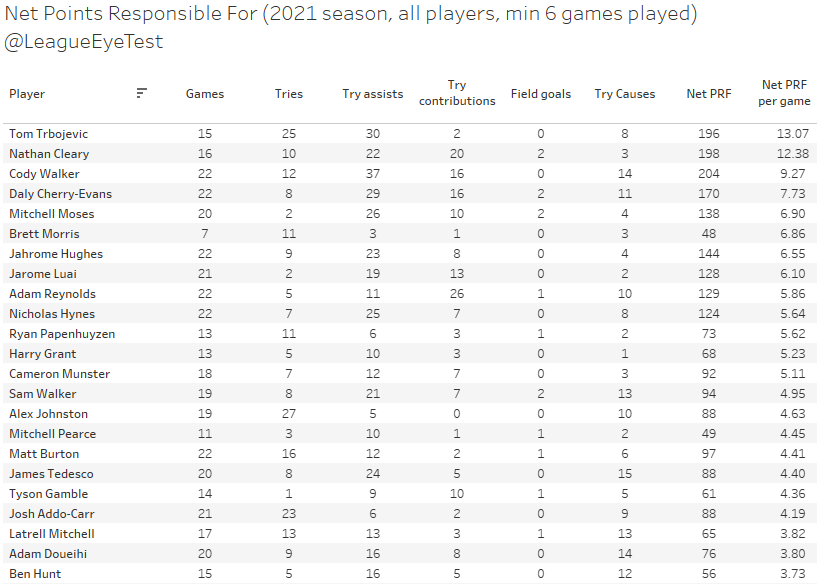
No surprises here with Tom Trbojevic’s devastating season topping the ladder here. The Manly #1 was responsible for +196 net points for his side, averaging out at +13.1 per game in his 15 appearances. Considering the Sea Eagles were +252 themselves, you could argue that Trbojevic was responsible for about 78% of their difference.
Again no surprises that Nathan Cleary was second, who was having his own amazing season at +12.4 net points per game, but was overshadowed by just how dominant Trbojevic was. In another non-surprise, third place was taken by Souths’ five eighth Cody Walker, who ended up with 37 try assists for the season and a net +9.27 points added per game.
Trbojevic’s +13.1 smashes the previous best of +9.7 by Cleary in 2020 by over 3 points per game, and Cleary himself beat his own record by nearly +3 points per game as well. Walker’s season was no slouch either, and is fifth overall since 2014.
Previous winners:
2020 – Nathan Cleary, Penrith (+9.72)
2019 – Luke Keary, Sydney (+8.63)
2018 – Cody Walker, South Sydney (+6.50)
2017 – Cooper Cronk, Melbourne (+8.21)
2016 – Mitchell Pearce, Sydney (+9.67)
2015 – Johnathan Thurston, North Queensland (+7.62)
2014 – Johnathan Thurston, North Queensland (+7.82)
Error Rate
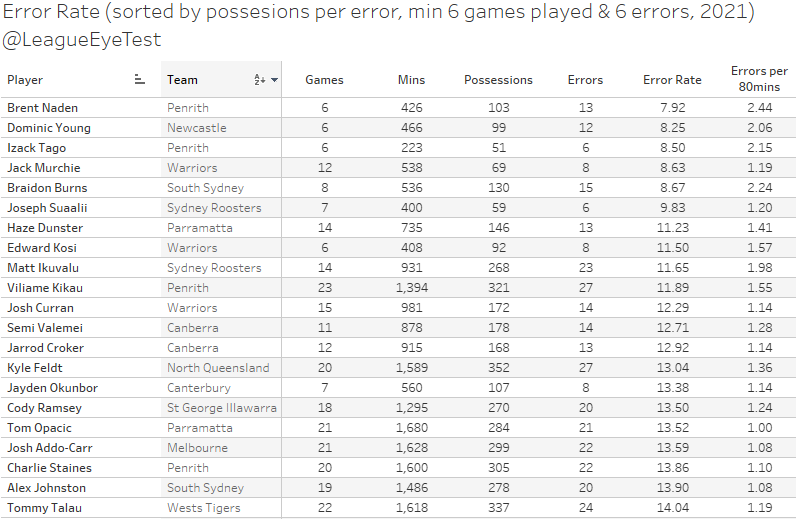
The award for worst hands this season has been won by Panthers outside back and future Canterbury Bulldog Brent Naden, who committed an error every 7.9 times he touched the ball.
Naden was followed by Newcastle winger Dominic Young, who committed an error every 8.3 possessions, with another Panther in Izack Tago rounding out the top three with an error rate of one every 8.5 times he handled the ball.
Roosters fans will not be shocked to see Matt Ikuvalu on this list, having committed 27 errors this season at a rate of one every 11.65 possessions, the worst of players with at least 200 touches this season. He barely beat out yet another Panther in Viliame Kikau who had a rate of one every 11.89 possessions.
Tigers rookie Zac Cini would have topped this list, as he committed nine errors at a rate of one every 6.2 touches, but he only played four games this season. That may be a reason why.
Previous winners:
2020 – Shane Wright, North Queensland (7.75 possessions/error)
2019 – Lindsay Collins, Sydney (7.89 possessions/error)
2018 – Will Matthews, Gold Coast (7.89 possessions/error)
2017 – Joe Wardle, Newcastle (9.33 possessions/error)
2016 – Corey Denniss, Newcastle (7.36 possessions/error)
2015 – Blake Ferguson, Sydney (8.57 possessions/error)
2014 – Kyle Feldt, North Queensland (7.06 possessions/error)
If you enjoyed this post please consider supporting The Rugby League Eye Test through one of the links below.
Scan the QR code or copy the address below into your wallet to send some Bitcoin to support the site Scan the QR code or copy the address below into your wallet to send some Ethereum to support the site Scan the QR code or copy the address below into your wallet to send some Litecoin to support the site Scan the QR code or copy the address below into your wallet to send some Bitcoin cash to support the site Select a wallet to accept donation in ETH BNB BUSD etc.. Donate To Address
 Donate Via Wallets Bitcoin
 Ethereum
 Litecoin
 Bitcoin cash
Support The Rugby League Eye Test
Support The Rugby League Eye Test
Support The Rugby League Eye Test
Support The Rugby League Eye Test
Donate Via Wallets


1 Response
[…] was the only player in the competition with a higher run rate than Nicholls’ 15.71% according to Rugby League Eye Test. While he won’t set the world on fire, Nicholls will rip in whenever he is on the field and […]