During the Raiders loss to the Cowboys on the weekend, Canberra five eighth and Dally M medal winner Jack Wighton did something he seems to do far more often than any other player in the NRL – kick a ball out on the full.
Andrew Voss mentioned it on commentary on Fox League as well, bringing up that according to the Fox Sports Lab he’d kicked out on the full 16 times since 2019. It’s something that appears to happen so frequently that NRL Twitter continually dunks on him for it.
This had me thinking, is Wighton the worst offender in this area? For this I’m looking at the kick error stat, which I’m using as a proxy for kicks out on the full. It may also be that kicks dead are included in kick errors. Apologies to those at the Fox Sports Lab in advance if that’s incorrect, but what can you expect from a time poor hobbyist analyst? But I digress.
Going back to the original question, is he the least accurate general play kicker in the National Rugby League? If you look at the raw totals Wighton is certainly up there.
Since 2020 (a delineation point for me as V’Landys era rugby league could very well be a different game), among players with at least 50 total kicks, Wighton has 14 kick errors. That’s equal third for that period with Daly Cherry-Evans, only behind Adam Reynolds (16) and Mitch Moses (19).
But as my faithful reader would know, here at the Eye Test we realise that raw counting numbers don’t tell the full story. It is worth mentioning that the players ahead of Wighton all had a minimum of 100 additional kicks over the Canbera #6.
Naturally, this led me to look at the percentage of their kicks that were errors, to see if his rate of kick errors was higher given that he had fewer kicks than the other playmakers. Looking at the data under this lens, Wighton certainly leads the way between those four names at 6.3%, ahead of Moses (5.4%), Reynolds (4.6%) and Cherry-Evans (3.8%).
Does that mean that Wighton is the least accurate kicker in the NRL? If you look at kick error in context of the whol leave, he sits in a slightly more favourable 10th position. Below is a visualization of the kick error percentage for every player since the start of 2020 with more than 50 kicks, showing where Wighton sits and who is above him.
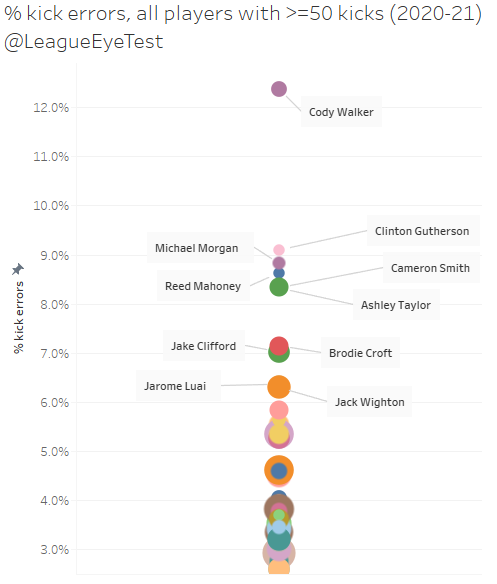
Some of the data points overlap (Cameron Smtih and Ash Talyor) so I’ve marked each data point at the top of the chart. There are some names ahead of Wighton that wouldn’t shock most fans, like Brodie Croft and Taylor.
However, the thing that stands out is not only that Cody Walker is the least accurate kicker, with 12 of his 97 kicks categorised as an error, but that his kick error percentage is nearly double that of Wighton’s at 12.4%. It’s also at more than three percent higher than the second least accurate kicker, Clint Gutherson at 9.1%.
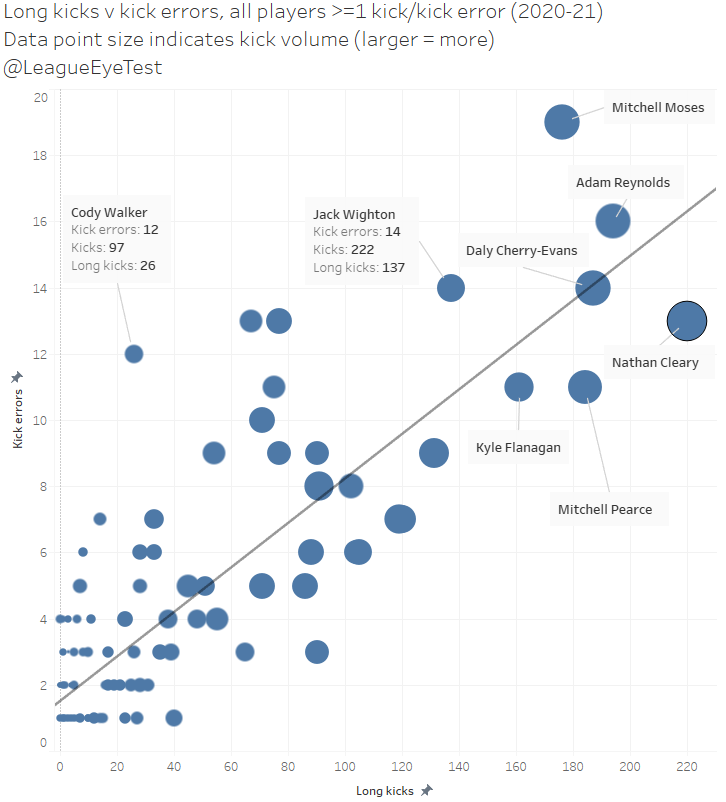
If you look at the same kick error percentage plotted against long kicks, it becomes a bit clearer that whilst Wighton does possess a wayward kick, he’s far from the worst offender in the league. Those above the trend line are generally less accurate than those below it.
Next time Wighton punts a ball over the sideline, feel free to have a laugh at his blunder but remember he’s barely in the top ten for kick error percentage in the NRL.
Set restarts mean fewer play the balls inside 20 metres
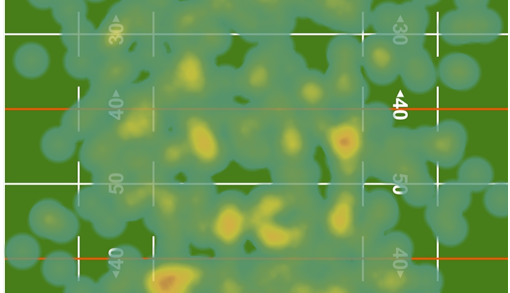
It’s well established now that set restarts are leading to more play through the middle of the field. But where does that play through the middle of the field occur?
Unfortunately, I don’t have the X/Y coordinate data to plot these play the balls, but there is data for tackled inside 50m and inside an opponent’s 20m area. So, we’ll use that aggregated play the ball data to look at any changes in location.
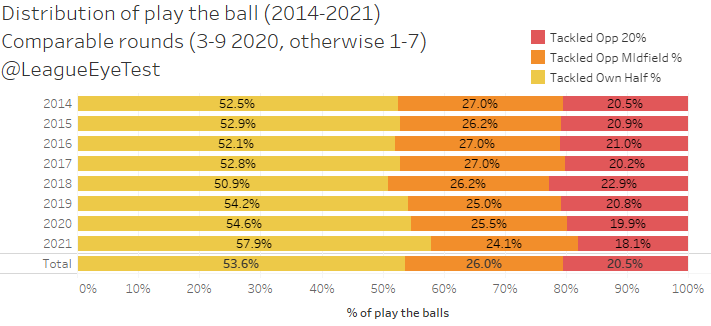
Looking at the first seven comparable rounds of the season since 2014 (3-9 for 2020), the percentage of play the balls inside an opponent’s 20 metre zone is 18.1%, the lowest point over the past seven seasons.
One of the reasons for this may be that a try can be scored from anywhere on the field, not just inside 20m, which is one of the great things about the game we love. Long range tries may have increased as well, but again that’s not data that I’m privy to as part of the great unwashed.
No surprises that this change in play the ball location corresponds with the percentage of play the balls in a team’s own half now approaching 58%, up from a low point of 51% in 2018.
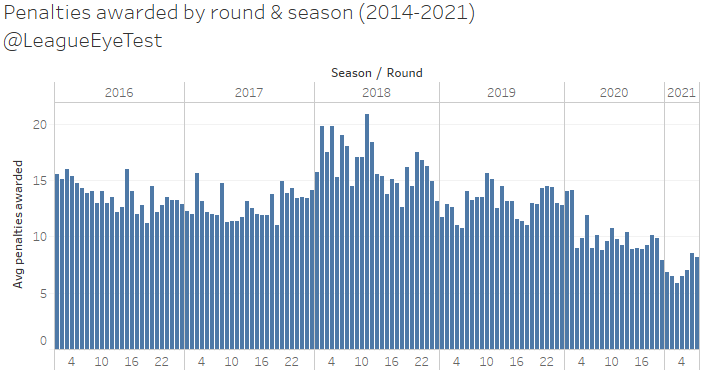
You remember 2018, don’t you? It was a wistful time, referees were cracking down on negative play with penalties, scrums were plentiful and there was nary a set restart to be seen. This led to the usual crisis merchants piping up and said crackdown ended.
The affect of these penalties were teams kicking themselves 20 to 30 metres into better field position, a far higher level of rugby league currency than a handful of extra tackles.
Below is the average number of penalties awarded per game by round since 2016. It’s incredibly easy to spot the point where negative voices were the loudest, around halfway through the 2018 season, resulting in things reverting to the way they were previously.
Back to the proliferation of own half play the balls, and it’s no surprise that teams exploiting the rules this season are to blame. Plenty of places have already documented it this season, including on this very site.
As teams regularly hold down players in the ruck or creep inside 10 metres, the only way for a side to advance the ball is to keep running it out of their own area. The previous bonus of field position has been removed.
Jack Snape penned a story on the weekend for the ABC that included a great visualization of where penalties were coming from, showing that a large amount of them are occurring early in tackle counts as teams run the ball off their own line. We’ve given teams a punishment that only incentivizes them to push the limits in order to maintain field position.
Again, no surprises that it has come to this and it’s clear from watching games that this is occurring far too regularly. But as I’ve mentioned before, one of the most important parts of analytics is being less wrong.
We’ve swug from one extreme (too much extra field position) to another (not enough). Whether or not you think this is a good or bad thing depends on what you value more – fewer stoppages or field position. Either way there’s probably a better mix than what we’re currently seeing.
A visualization that summarises Brisbane’s recent decline
Whilst looking at data for the above section, I also checked a few teams’ play the ball location profiles to see if there was anything of note. Some of them were nondescript, some looked quite random, and then I got to the Brisbane Broncos.
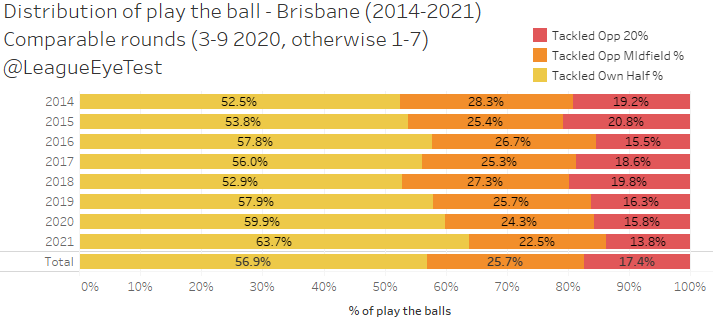
Over the first seven rounds of the season, they’ve increased from 52.9% of play the balls in their own half in 2018 when they finished sixth on the ladder, to 59.9% last season and a disastrous 63.7% this season. That’s nearly two thirds of their total play the balls, and just 13.8% inside opponent 20 metre zones.
Is it any wonder they are struggling to score points and their halves are always under extreme pressure?
The worst hands in the NRL thus far?
With seven rounds complete it’s a good time to check out which players have the highest error rate for the 2021 season. Previously, I’ve defined error rate as how often an error is committed measured by the number of possessions needed to produce one. Here’s the breakdown of error rate for the 2021 season thus far, for players who have played at least three games and committed at least three errors.
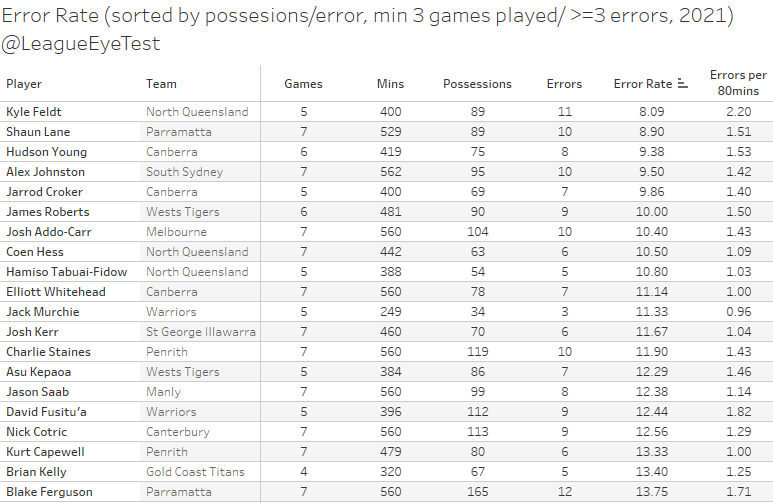
It’s grim reading for several fanbases. Somehow Kyle Feldt has managed to commit an error 11 times in 89 possessions, or one every 8.09 times he touches the ball. This may explain Todd Payten always looking so displeased. Anyone watching the Eels this season knows the lottery that is a ball passed to Shaun Lane, with the Eels edge making a mistake every 10.4 touches. His team mate Blake Ferguson is just as worrysome with his ball handling (12 total errors this season), but doesn’t rate as poorly as Lane on this list due to having almost double the touches (165 versus 89).
Raiders fans probably aren’t surprised with the number of players from their club in this list either, headed by Hudson Young (an error every 9.4 possessions). Jarrod Croker and Elliot Whitehead also commit an error inside every dozen touches. It’s hard to win football games when you’re unable to control the ball.
And that’s not even accounting for Jordan Rapana, who sits just outside this list with 13 errors at a rate of one every 13.9 possessions. He’s only saved by how many times he touches the ball, nearly double Feldt at 181 in seven games. Dunamis Lui also would sit inside this list with an error every 11 possessions, but he’s only committed two of them in his three games and hasn’t met the minimum.
The only positive thing in this list for consumers of green milk is to see Nick Cotric’s name in it.
Header image – “Jack Wighton chuffed with the win” by reepy_au is licensed under CC BY-SA 2.0
If you enjoyed this post please consider supporting The Rugby League Eye Test through one of the links below.
Scan the QR code or copy the address below into your wallet to send some Bitcoin to support the site Scan the QR code or copy the address below into your wallet to send some Ethereum to support the site Scan the QR code or copy the address below into your wallet to send some Litecoin to support the site Scan the QR code or copy the address below into your wallet to send some Bitcoin cash to support the site Select a wallet to accept donation in ETH BNB BUSD etc.. Donate To Address
 Donate Via Wallets Bitcoin
 Ethereum
 Litecoin
 Bitcoin cash
Support The Rugby League Eye Test
Support The Rugby League Eye Test
Support The Rugby League Eye Test
Support The Rugby League Eye Test
Donate Via Wallets