
When I launched the Eye Test’s expected points model (ETxP) for the National Rugby League over a year ago I had some new types of analysis planned for the season. Sadly after losing access to some of the data I had to shelve most of those plans.
However they were only shelved temporarily and not binned completely. Thankfully with the return of data needed to calculate ETxP I can start these up again. With Round 6 of the 2023 season now complete, it’s time to start using them for more than just expected points.
Thank you for reading The Rugby League Eye Test. Subscribe below to receive new posts in your inbox
The first is looking at the average field position of the first play the ball in a set. The idea behind this is to see how far downfield teams are starting their sets and if that gives them any sort of advantage.
Note that this is the location of the first play the ball, not where they receive the ball. A team that does well returning kicks will fare better in this regard, whilst one that is catching the ball close to their own goal line will suffer.
What we can also do with this information is track the distance between each play the ball in a set. By looking at the subsequent distance between each ruck we can negate the influence strong kick returns have on where a set starts.
Another thing to keep in mind is that this is the average play the ball position of the first play in every set. The first tackle after a team is awarded a set restart 10 metres out would be part of this. However as the average NRL team sees about 20% of their play the balls occurring inside 20 metres and approximately 50% inside their own half, so whilst this will skew the data somewhat it’s not making a massive difference. So we’re leaving it in (for now at least).
I’d like to note that this is the distance in metres between each play the ball, not the distance of a run. For example, if the Broncos are playing the ball 40 metres out, and Tom Flegler receives the ball 2 metres behind the ruck but runs for 8.7 metres, the next play the ball is 6.7 metres downfield. We’re differentiating between metres gained by a player and metres gained by the team past the advantage line or gainline or whatever you want to call it. It seems a little counter intuitive at first given that the average run distance is just under 9 metres (per Fox Sports stats, my usual source), but once you take into account the run starting behind the play the ball it makes sense logically.
If you’re enjoying the posts on this site and want to support independent rugby league content, please consider donating to The Rugby League Eye Test with a value of your choosing via the link below.
With the caveats out of the way, just how far down field are NRL teams playing the ball this season? Below is a chart of how far downfield each team had their first play the ball.
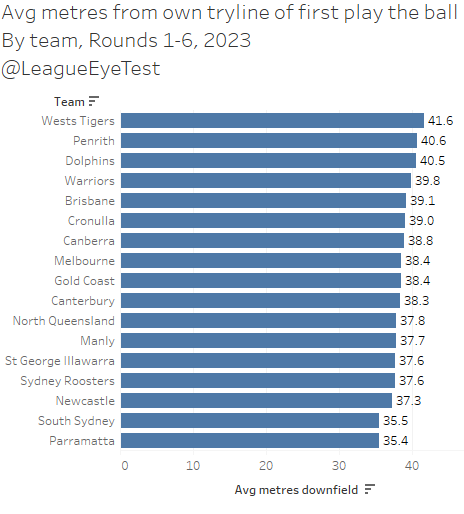
If you guessed that the Wests Tigers had the average first play the ball of their sets starting nearly 42 metres out and leading the NRL, then you win a prize. That’s ahead of Penrith, who have found their attacking form of late, who see their first play the ball 40.6 metres out. The only other team to start their first play the ball over 40 metres out are THE Dolphins, also at 40.6m.
At the other end of the scale are two teams that have had their struggles earlier this season. Both South Sydney and Parramatta averaged just 35 metres out for their first play the ball in a set. Everyone else in the competition starts at least 37.3 metres from their own try line.
And as you know here at the Eye Test we not only look at how a team is performing, but how opponents are faring against them. Below is the same chart above but by opponent instead of team.
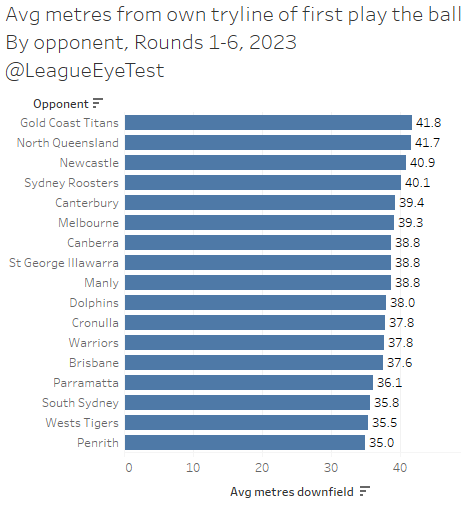
Both the Gold Coast and North Queensland are conceding their first play the ball almost 42 metres out on average, with Newcastle not far behind at 40.9 metres. Not a great look for any of those teams although somehow two of them are inside the top 8 currently, which probably says more for how even the season is than anything.
Unsurprisingly teams facing Penrith are starting with the weakest field position, averaging 35 metres out for their first play the ball. And given that we’ve established that the Tigers have some of the best field position in the competition after starting the furthest down field, it’s not a shock for them to rank second in this metric at 35.5m. If only they could score some points with all of that quality field position and possession.
As mentioned before, about 20% of play the balls occur inside 20 metres, which is pulling this average starting point downfield. What if we removed those play the balls, just how different would the numbers be?
One reason for doing this is that as I noted on twitter on Monday evening, the Wests Tigers are second in the NRL in average play the balls inside 20 metres (32.2 per game), despite being last on the ladder, and last in points scored behind some teams who have played one less game. The full list is in the tweet below.
The team they lost to on Monday, Parramatta, are dead last in tackles inside 20 metres averaging just 21 per game. More proof to something I alluded to a few weeks ago that tackles inside 20 metres have almost no correlation with scoring points. But as a great man once said, you miss 100% of the shots you don’t take and being 20 metres away from the try line certainly gives you more shots at it. If you take them.
Wests Tigers percentage of total play the balls inside 20 metres is first in the NRL as noted above, which again should prove that it’s a relatively worthless statistic in a vacuum without the context of points and tries scored.
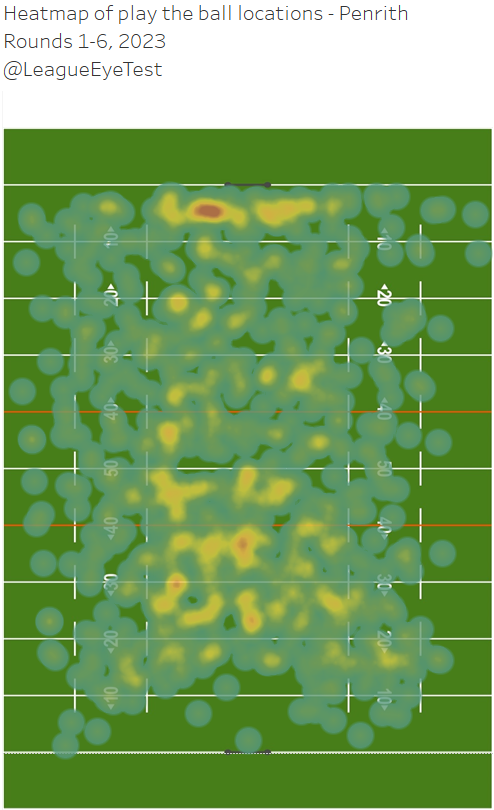
Just how cooked are the Tigers with the ball this season, especially close to the try line then?
To show this, here’s a heat map of Penrith’s play the ball locations this season, which has netted them three wins and 141 points in five games (28.2 per game).
And here’s the Tigers field position, which has netted them 0 wins from six games, a secure hold on last place and just 90 points (15.0 per game), the lowest in the NRL and below than teams that have played one less game.
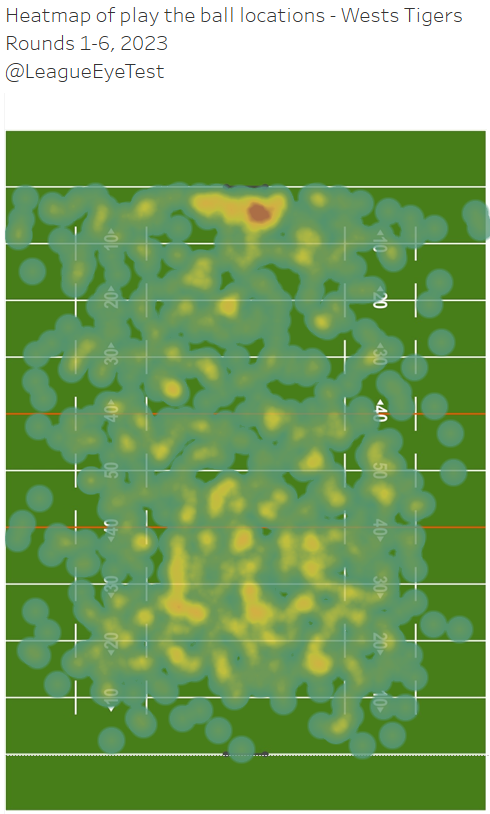
It’s amazing that two teams can have such similar field position and possession yet totally different outcomes.
And just to show that not all teams are the same, here’s the 17th placed team in play the balls inside 20 metres, Parramatta, who see just 14% of their total play the balls occuring in the red zone

They’ve managed two wins and 133 points (22.2/game) from their six outings this season.
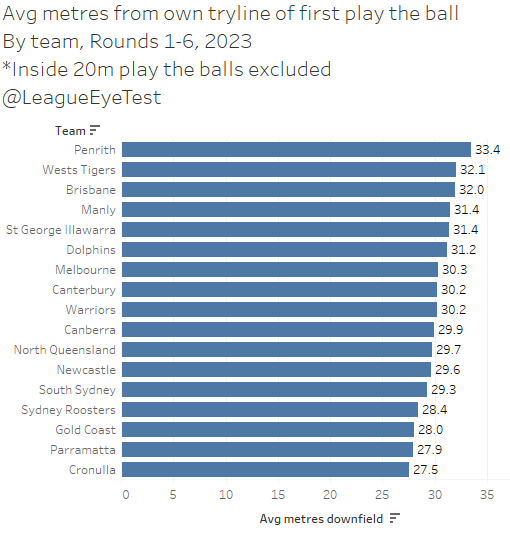
Back on track, we know the Tigers over index in play the balls inside 20 metres. If we remove them, here’s the average first play the ball positions of each team.

Most teams lose about 8 metres from their average, with Penrith now sitting first at 32.1 metres for their first play the ball, a full metre above Wests Tigers in second place. You can see that even taking out their foibles inside their opponents red zone the Tigers still start higher up field than all but one NRL club.
The biggest change here is for Cronulla, who sit last and play the ball just 27.5 metres out from their own goal line once you remove play the balls inside 20 metres. That’s a significant fall from their overall placing of 6th at 39.0 metres, a difference of 12 metres for their 1st tackle location.
This might be part of the reason why the Sharks have had their issues this season, like giving up a huge lead to the Warriors. Needing to constantly generate more metres to ensure they’re at a similar spot downfield to the rest of the competition is hard to maintain consistently.
For those who want something easier to digest, I’ve also plotted this on a field with some average width as well to visualise the starting point for these teams.
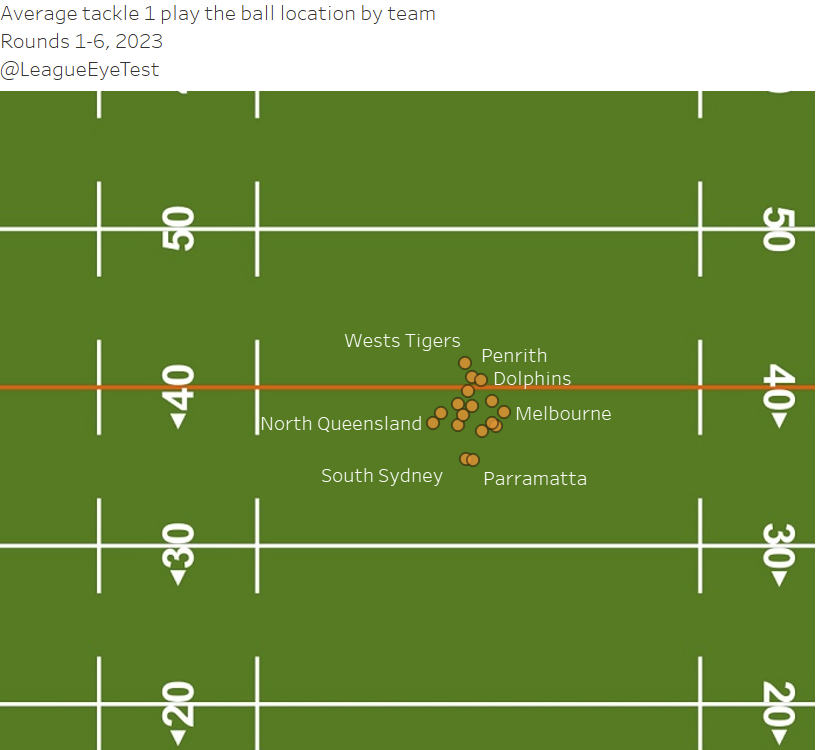
Keen observers will spot in the above chart that some teams are playing their first ball a bit wider than others, so I decided to look at how far from the centre of the field they’re playing the ball.
First up is the average distance either side of the middle of the field, with negatives indicating to the left and positives to the right.
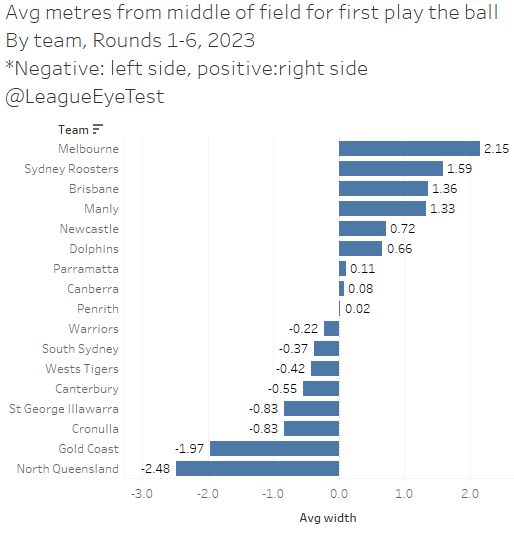
These are small numbers ranging from 2.15 metres left (Storm) to 2.48 metres right (Cowboys), so as seen above everyone is mostly working in the same space laterally on field. If anything it’s more of a reflection of who the ball is being kicked to and where they like to return it.
Interestingly as you get later in the tackle count, a few teams start to venture wide earlier. Most notably of these are the Gold Coast (to the right) and Manly (to the left). But it’s not enough distance to be relevant this early in the season. Someone out there will no doubt be banging on about needing to earn the right to spread the ball early.
What is more relevant than width is looking at the distance between each subsequent play the ball. Again, I want to emphasise we’re looking at team metres gained, not individual player metres.
To show this I’ve put together a heat map chart below to show the distance between each play the ball for each team by tackles 2-5. Obviously tackle 1 is excluded because it’s the (usually) the start of a set and players being tackled on the last is an uncommon occurrence so that’s why we’re stopping after five.
Back to the table. This chart shows the metres between each play the ball by team, with each cell shaded from red (the lowest) to green (the highest). It makes identifying the high and low points easy to spot and any overall trends clearer.
Below is the chart for rounds 1-6 this season by team. Blue is good, orange is bad, and the darker the colour the closer to each extreme the data is. I’d usually use red & green here, but I’m looking out for my colour blind readers.
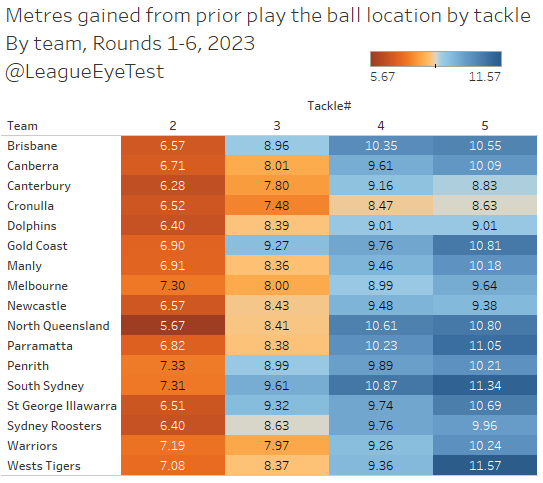
When you look at the results from a tackle perspective there’s nothing overtly shocking. The distance between play the balls on earlier tackles is lower than on later tackles when teams spread the ball and try to break through or get around their opponents defensive line.
Melbourne, Penrith and South Sydney have the strongest numbers on tackle 1 to 2, all making more than 7.3 metres from their first to second play the ball. And not only do South Sydney start their set off well, they continue it, posting the highest numbers for tackle 3 and 4, and second highest for 5th play the balls.
North Queensland seem to struggle making metres early, advancing the ball just 5.67m from their first ruck, although they do gain some of that back with above average metres on late tackle as one of just four teams with double figure metres gained from tackle three to four.
The Sharks are another curious case here. We already showed that they start their sets further back than any NRL team, and here we can see that they also have some of the lowest distance gained between tackles 2 to 3 (7.48m), 3 to 4 (just 8.47m) and 4 to 5 (8.63m).
They’re the only team in the competition not to gain at least 9 metres on their 4th play the ball, and one of just two (along with Canterbury) who gain fewer than 9 metres with their 5th play the ball. The Dolphins aren’t much better at 9.01m for their last two tackles in a set, but they’re still ahead of the Sharks on each tackle.
And if we flip it to look by opponent we get some incredibly interesting outliners. Note the colours are flipped here and orange is good, blue is bad as we’re looking at who is playing each team.
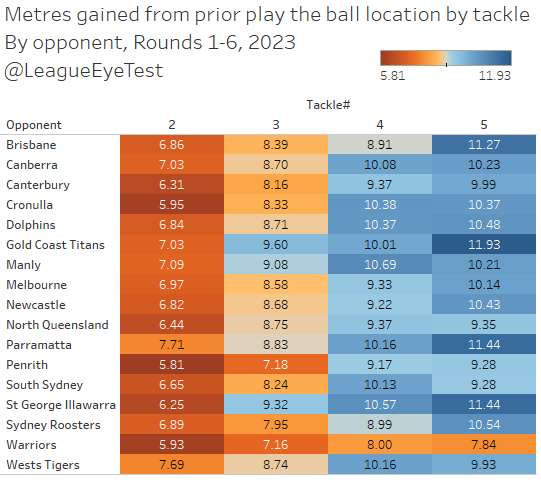
The first to me was the performance of the Warriors, who have historically been a poor defensive team. From that chart we can see they have the second lowest metres between first and second tackle play the balls (5.93m), and the lowest for tackles 2 to 3 (7.16m), 3 to 4 (8.0) and 4 to 5 (7.84).
The Warriors 7.84 metres between play the balls 4 and 5 is lower than some teams from 2 to 3 (the Dragons 9.32 or the Titans 9.60 for example). Their second to third tackle metres conceded even outranks Penrith at 7.16m. If you’re looking for a reason why the Warriors have been performing well this season, their late tackle defense may be it.
What is also clearer is a possible reason why Parramatta has been struggling. They’re giving up the most metres from tackle 1 to 2 (7.71m) and equal second highest from tackles 4 to 5 (11.44m). All of this negates the good field position they create as shown above with their opponents first play the ball occurring 36 metres out, fourth best in the competition.
A lot of that was on display on Monday, where they were behind on nearly every single statistic except the one that mattered – the scoreboard. The expected points from that game, where the Tigers dominated, can be seen below.
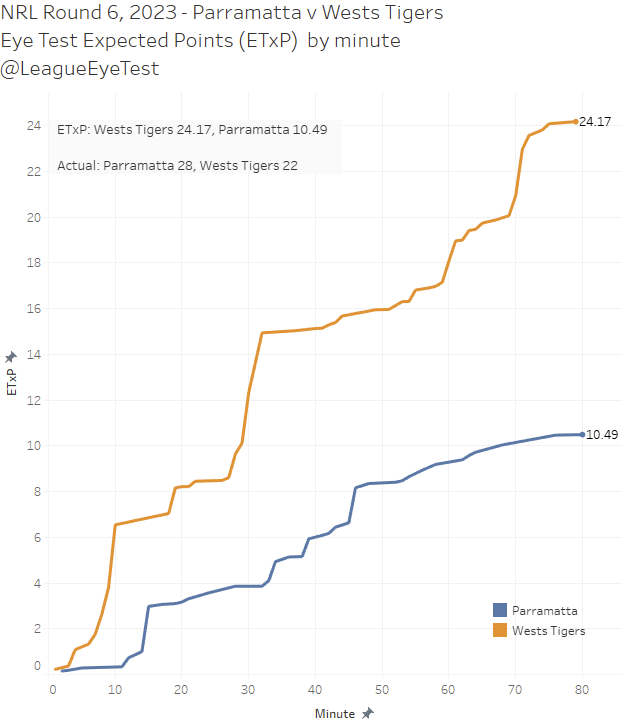
It’s by far the most one sided expected points chart I’ve seen since I started doing this, with data going back to 2016 (press F pay respects to 2022).
And whilst all that matters is that the Eels got the result they wanted on the day, it’s not something I’d want to make a habit of.
If you enjoyed this post, please consider donating to The Rugby League Eye Test with a value of your choosing via the link below.
