With the Rugby League Players Association and the NRL finally signing their collective bargaining agreement, one of the feel good stories of the year can hopefully have its fairy tale ending.
That being 32 year old Shaun Johnson winning the Dally M medal for player of the year.
Given the sheer volume of #ShaunHub content this past fortnight and so many people touting him as the favourite for the Dally M medal, I thought I’d take this week to go through a thought experiment. What would a Dally M or “player of the year” award look like if we used a voting system based purely on statistics?
Friend of the site Liam of the Maroon Observer (and PythagoNRL before that) went through this in 2021 when there was a lot of talk about changing the Dally M voting system. His fantastic post examined how his TPR or WARG metrics could be used as a proxy for creating a voting system and is a great read.
The results were varied but ultimately came down to what you’re trying to measure. Is it the best player? Or the best and fairest? And for this thought experiment I’m just going use it to find who was the “best” player this season, or “player of the year” if you want to use that vernacular.
I’m going to take a similar but slightly different approach. I’ll use my own Eye Test Player Contribution Rating as the base metric, but rather than find a new system that works, I’m going to try to work within the confines of the current Dally M system where possible.
I already have ETCPR numbers for every player in every match this season (and prior seasons). For each match, we’re going to take the top three ETPCR scores and give them 3-2-1 points, just like a Dally M voter would do. Then we’ll tally up the points scorers and see how they rank.
Moving forward any references to “votes” is interchangeable with “points”, and indicates that a player was awarded a number of points for having an ETPCR that placed them inside the top three per match. Hopefully we can create a similar system that makes sense. All player stats are from Fox Sports Stats.
The first pass would be to just rank players by season average ETPCR, which is shown below.
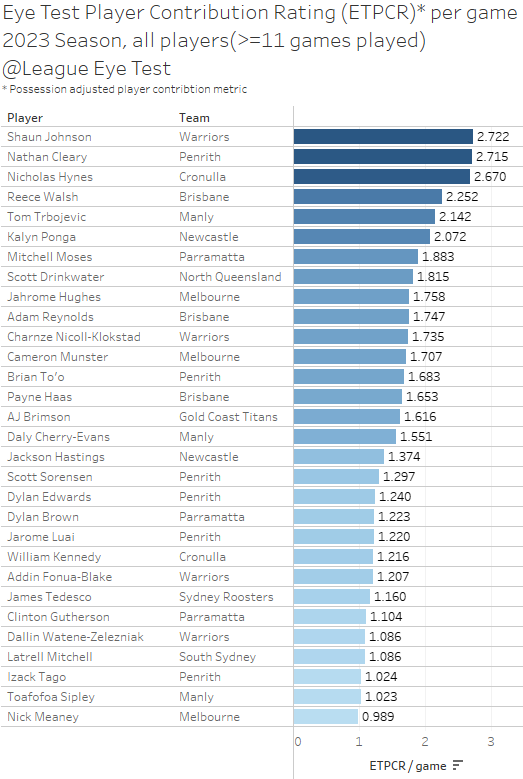
The above numbers is the ETPCR score per game a player contributes to their team, adjusted for possession. It passes the eye test (not this one, the other one), with the top three of Shaun Johnson, Nathan Cleary and Nicho Hynes within 0.1 ETPC of each other, which is a very close race.
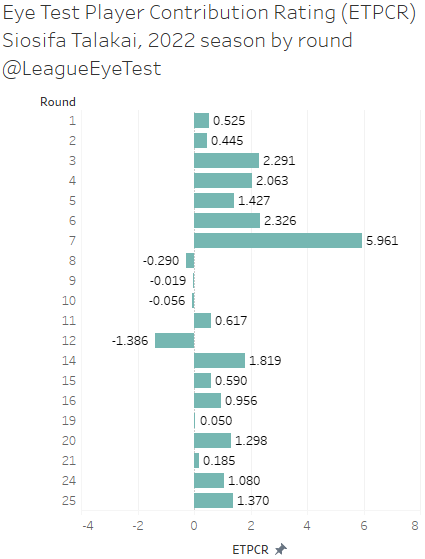
However, this chart is using an overall season average, and that’s not necessarily representative of how the Dally M works, which is voted on a per game basis. Season averages could be skewed by someone like Siosifa Talakai having one monster game against Manly and then nothing of note for the rest of the season, yet still featuring in the top 30 player list for the season. Here’s a breakdown of Talakai’s 2022 season by ETPCR to illustrate my point.
It might tell me who was the “best” (on average) player of the season, but not necessarily who had the highest number of meaningful games or was consistently the “best”.
The second attempt was to check ETPCR scores for every game this season and “award” a 3-2-1 vote for the top three ranked players from those matches. Basically the “old” Dally M system. Below are the top 20 players by a straight top three scoring players from each match up to Round 23 this season.
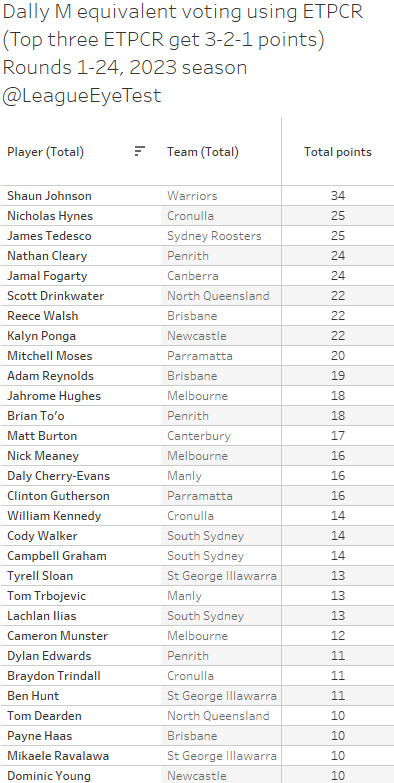
The list isn’t too bad at first glance. Shaun Johnson has had a career season and is probably favoured to win the actual Dally M this season and would win here with 34 votes. Nicho Hynes is in second place behind him and has picked up several votes from games against sides in the bottom 9, along with Nathan Cleary both on 26 votes and either wouldn’t be able to catch him with the remaining number of matches.
James Tedesco would be third which might seem strange considering the Roosters season but would have scored votes in just 9 games, where Johnson (13) and Hynes (12) were meaningful in more games. Which means Tedesco can still have an impact in matches, but not as often as he would historically.
Every single one of these players has been inside the top three ETPCR scorers in at least eight games this season, and in the case of Hynes and Johnson, at least 12. That’s the sort of consistency I would be looking for, not having one or two massive games then regressing to the mean.
But as you look a bit closer, one thing pops up and once you spot it, it’s glaringly obvious.
There’s just a single forward in this list. The highest ranked forward is Payne Haas, with 10 points and sitting in 28th place. The next forward would be David Fifita, in 41st place with 7 points tied with teammate Philip Sami.
Historically, Dally M awards usually go to backs and specifically halves, with only three forwards to have won the award since 1990 (Cameron Smith x2, Jason Taumalolo and Danny Buderus). I wouldn’t expect them to be dominating this either. Statistics like tries, try assists and line breaks have the highest correlation with winning and margin of victory, and the majority of those are scored or set up primarily by backs. But they still should be represented a bit better than having 15 players inside the top 100 vote getters by this method.
The conclusion from this approach is that it probably ranks positions 1-7 in a sufficient way, but ignores forwards as they rarely feature in the top three ETPCR scorers per game due to the above reasons.
That led me to the second method – awarding 3-2-1 points for backs and forwards for each game. Given the real life Dally M voting this season has gone to six votes from two judges, this might be a more equitable way of distributing votes. The results are below.
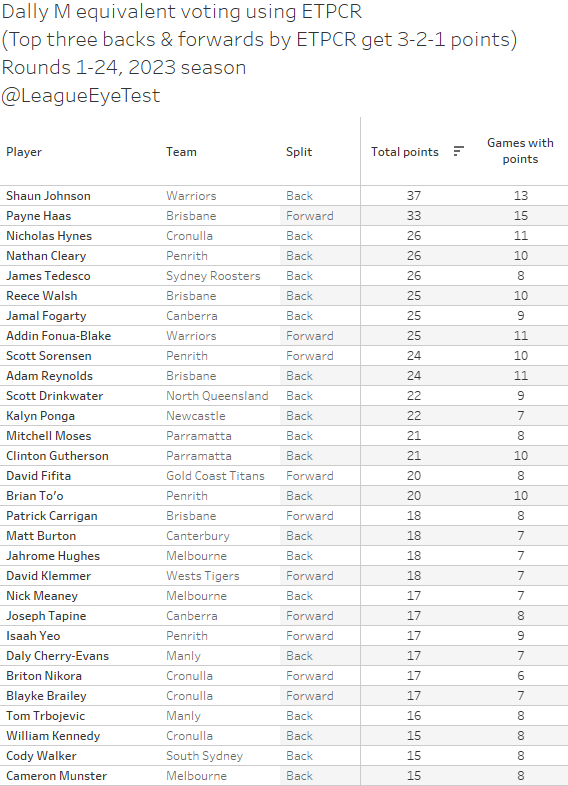
We’ve got some forward representation now, but they’re over indexing slightly here. I don’t think anyone would argue too much if you said Payne Haas was the best player in the competition this season, having Scott Sorensen in 9th and above Scott Drinkwater or Kalyn Ponga is probably bit much even if he’s been excellent for Penrith.
And as you get further down the list the representation of forwards does continue to increase. Along with Haas, Fifita, Addin Fonua-Blake and Sorensen, you have Pat Carrigan, Isaah Yeo, Joe Tapine, David Klemmer, Briton Nikora and Blayke Brailey in the top 30. As good as some of them have played this season, I don’t know if I’d have them as top 30 players.
In an example of how this over represents forwards, Cameron Munster drops down to 30th under this method, on the same number of points as his teammate Josh King. I think even Josh would admit that is a bit wild. The insight to be drawn here is that whilst backs are usually the top scorers in a top three player scenario, the makeup of those three players tends to fluctuate. Whereas the top three forwards are generally more consistent, scoring similarly in more games with fewer extreme variations.
Simply, the best forward would have always received three votes, even if his ETPCR score was lower than the 3rd placed back. And in some instances, it was lower than the 4th or 5th placed back as well. This should have been obvious from the beginning.
Given this information, it gave me another option for “awarding” these votes. Instead of just having 3-2-1 points for backs and forwards and combining them, I’ve taken the six players and re-ranked the combined list and scored them 3-3-2-2-1-1. Not exactly the same as the current system, but it does allow for six different players to receive votes.
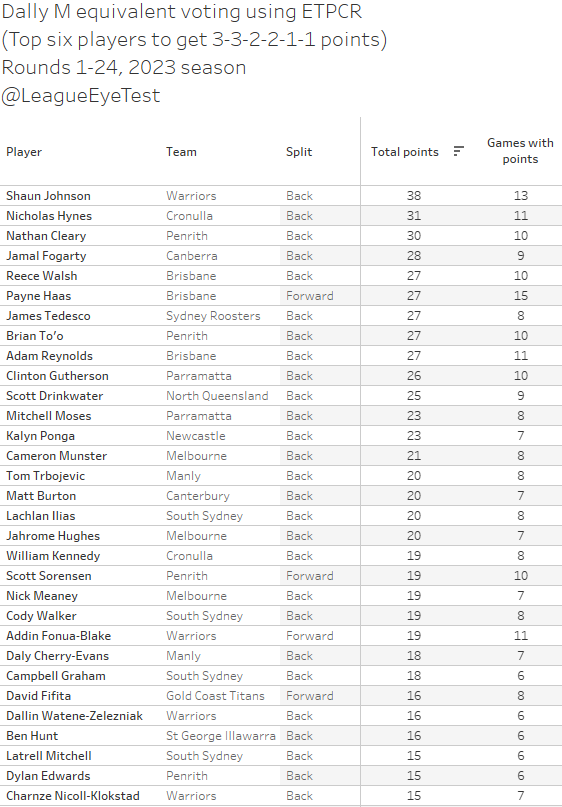
The results are below and look promising as well and swings things back to something that looks more in line with what you’d expect.
Johnson still ends up first, ahead of Hynes by six points with a few rounds remaining. Then you have a nine point gap to Drinkwater, with Jamal Fogarty two points behind, followed by Haas and Tedesco on 46.
As noted above, Tedesco’s position does seem high given the Roosters ordinary season, but he did only place in the top three backs in eight of their 21 games thus far, the fewest of any players inside the top 10.
The big outlier here for most people would be Fogarty. He has had some very impactful games, such as the Round 18 game against the Tigers when he scored two fantastic tries off kicks. His positioning here is probably more an illustration of how little impact the rest of the Raiders back line has been, and how their strength has been through their forwards. I don’t consider his position “wrong” or “incorrect”, just unexpected. A lot like the Raiders up and down season.
For 2022, the results also look justifiable as well.
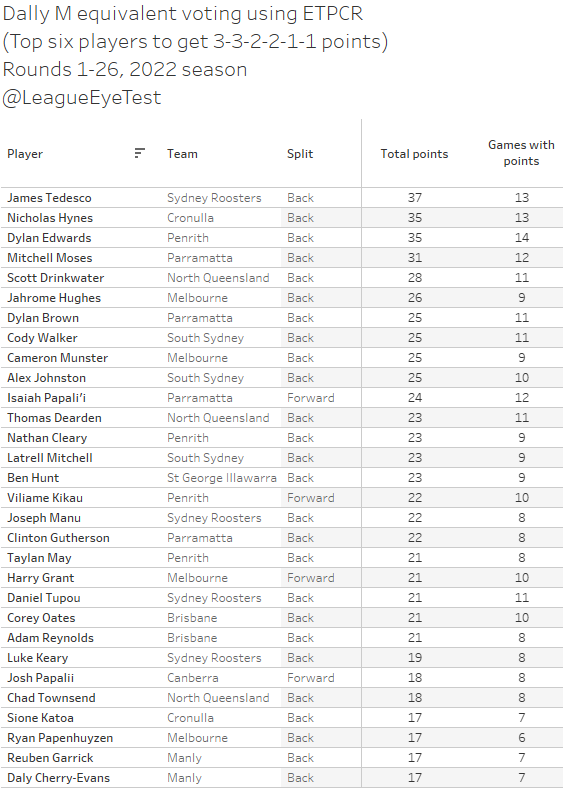
Tedesco would have been named the top player of the year, just ahead of Hynes and Dylan Edwards who were tied for second place. Latrell Mitchell ranks 12th, which puts aside fears I had about a system like this mis-rating him. The one player missing from this list for me would be Joe Tapine, and he’s just a handful of votes out of 30th place. Plus, he looks to have split forward votes with Josh Papali’i and Hudson Young.
I’m reasonably happy with this version, but I wanted to check how things would look if we used a 6-5-4-3-2-1 voting system instead of the 3-3-2-2-1-1. Under this method the best player for each match is getting the equivalent of two first placed votes from both judges.
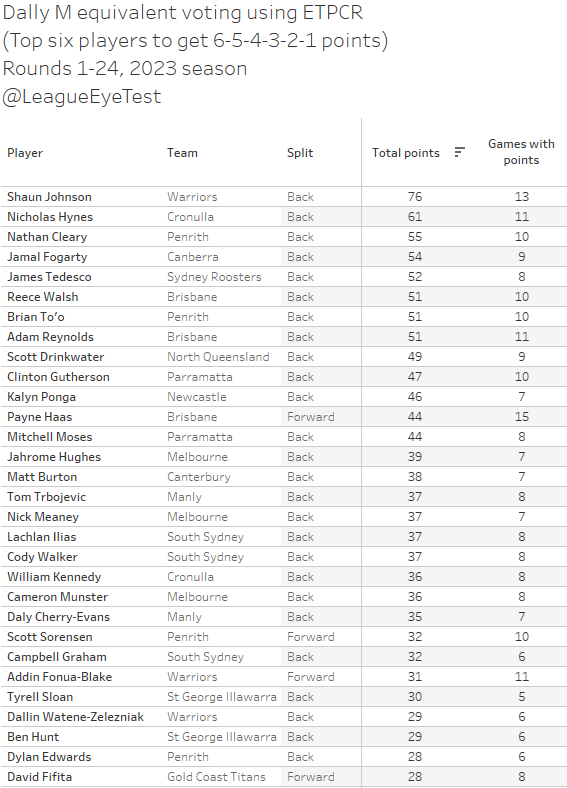
Clearly whatever method I’m using, Shaun Johnson would be the player of the season, with Hynes and Cleary close behind. And there’s no question that Haas has been the best forward thus far.
This last method is a bit closer to the original method of just using 3-2-1 based on the top three scoring players with slightly more forward representation. Haas ends up in 11th spot which given the players above him isn’t a bad spot to be in with the known limitations of the metric used.
Fonua-Blake, Sorensen and Fifita also stay inside the top 30, while Carrigan isn’t far away on 36 and just a handful of points away from 30th position.
In the end, I’ve come to a similar conclusion Liam came to when he went through this. There’s no way to create a perfect method, and having some level of human involvement in the system is useful, especially now that they’ve moved to multiple voters. The method of using a 3-3-2-2-1-1 voting structure for the top six players per game seems to work well, while the 6-5-4-3-2-1 method is probably the next best result but it still probably under represents forwards.
That’s not to say the current voting method with humans is infallible. Lachlan Miller had 17 points after Round 12, more than Nicoll-Klokstad or Fifita after Round 12, when the Knights had won just four games. His demotion from the #1 jersey to allow for Ponga to return to fullback is possibly a catalyst for the Knights impressive turnaround in form.
A single statistical method for awarding 3-2-1 points for each game is always going to favour similar types and styles of players. It will always be influenced by the judges view on what makes a good rugby league player or contributes to a winning team. It will never be able to qualitatively evaluate players or measure how much the influence a player had.
There’s more than a handful of caveats from this approach as well. The first is that, as Liam mentioned in his post, none of these metrics cover everything that happens on field. It’s a curated list of statistics that I have found to correlate highly with winning games and an increasing margin of victory. But it’s still decisions I have made from publicly available information, and it’s not a complete or exhaustive list of everything that contributes to winning. I’m not objective and neither are you, and a model is only as good as its inputs. Garbage in, garbage out.
Specifically, neither myself or Liam use tackles completed since it has a negative correlation with winning games and the margin of those wins. Making a lot of tackles is probably an indication that a team was targeting that area of the field more than anything.
That does pose an issue for hookers and middle forwards, the former who are primarily about service and defense, and the latter who are mostly about running and tackling. If you take out half of the game, even if it isn’t reflective of positive contribution, then it’s hard to properly evaluate them.
For hookers especially, it over emphasises attacking hookers who create points (Harry Grant) or those who make a lot of negative plays (Reed Mahoney). This leaves a grey middle ground where you have 80% of the game’s dummy halves who are all rated somewhat similarly.
The second is that we’re only quantifying involvement, there’s no qualitative element to it. A line break or a try would be valued the same whether it was a game winning play or a disrespectful score late in a match whose result was determined after 40 minutes. Someone like Latrell Mitchell might fare worse here, because the subject layer of how much he changed the course of the game is very had to quantify. Where a player like Dylan Edwards, who is constantly active and doing things on the field, is far easier to measure.
There’s no simple way to assign impact to these statistics, which is a double-edged sword. It is independent so you don’t get people voting on players who they didn’t see because they themselves were involved in a match at the time, but then you also miss out on the ramifications of a game changing play.
I don’t think there’s a way to fix this in the short term, and whilst I could add more caveats and conditions to the metric, I’d like to remain as removed as possible from a process that already has some subjective measures in it.
Still, as a thought experiment this process did prove useful in that this type of method has some value in looking at players this way rather than just voting on feels and vibes alone. Like anything statistically, taking things in isolation is rarely useful, but as starting point for a discussion or further analysis they can be applicable in many situations.
The other thing I’ve drawn out of this analysis is that Addin Fonua-Blake is having an incredibly under-rated season. When the actual Dally M voting went dark after Round 12, Fonua-Blake wasn’t anywhere near the top of the list, and he’s probably been losing votes to Johnson, Nicoll-Klokstad, Tohu Harris, Dallin Watene-Zelesniak or any number of other Warriors players. Yet by most of my methods above he’s been ranked as the second best forward in the game, and inside the top 30 players by ETPCR.
Warriors coach Andrew Webster noted this week he thinks he’s the best front rower in the competition, and the numbers tend to back that up.
“He’s got to be the best front-rower in the competition at the moment. He was unbelievable.”
If we look at his percentile ranks of per game averages this year, he might be right.
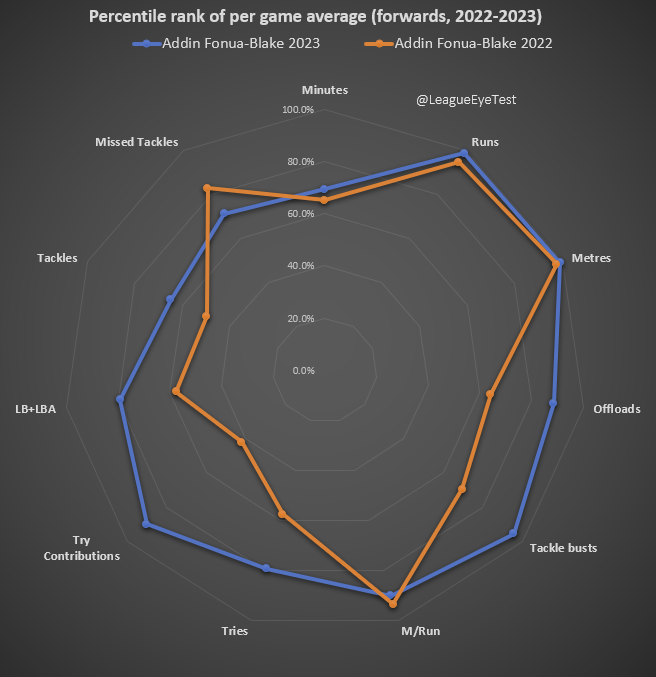
Fonua-Blake’s per game averages for 2023 (blue line) are in the 99th percentile of all forwards (only 1% of ahead of him) for runs and metres, and the 95th percentile for tackle busts. He’s in the 90th percentile for metres per run and try contributions (tries, assists and involvements), and 89th percentile for offloads per game. In those 99th percentile cases, the only player he is behind is Payne Haas.
All this despite being in just the 69th percentile for minutes played, meaning 31% of all forwards play more minutes. And if you look at the improvements on 2022 (orange line), almost everything has increased in percentile rank except metres per run and missed tackles with only a margin increase in minutes played.
The increase in missed tackles can be put down to him attempting more – his tackles per game percentile increased from the bottom half of the competition (49th) to 65th. And his as much as I don’t treat tackle effectiveness as a key stat, he’s still in the 96% range with an increased workload.
We always hear about how good Haas, Carrigan, Yeo and Tapine have been, and rightly so, but it’s rare that Fonua-Blake is talked about in the same circles. From this evidence it’s clear that not only should his name be included in those conversations, but he can stake a claim to be at the top of them.