There’s just one round of the regular season remaining, and August is in the books, so it’s time for the final monthly NRL efficiency update for 2023.
And this month we will be focusing mainly on the Panthers. Not that they have not been a large part of each of the previous updates, as it’s hard to exclude such a domineering team. But I’d been focusing on covering teams other than Penrith because they get enough coverage as it is, and there’s only so many times you can fawn over just how well they’ve been playing.
It’s been three seasons now and they’ve passed the point of just being incredibly good and are approaching the dynasty label. To be this good for an extended period is an incredible achievement. Their opponents from last Thursday are a stark reminder just how quickly things can go south in rugby league. Yet Penrith are still dominating and seem likely to play in their fourth straight grand final this year.
Despite this dominance there are starting to appear some weaknesses showing lately. Jarome Luai’s shoulder injury has certainly created some concern, as the Panthers record without their number six isn’t fantastic. They showed how they could still fire as a team without Nathan Cleary whilst Jack Cogger deputised, but filling in for the dynamic Luai is a harder task.
The expected point chart of their 32-18 loss to the Eels on Thursday was dramatically un Penrith like and another time the Eels have gotten one over on their rivals. Just a shame that Parramatta has never done it when it mattered, but that’s beside the point.
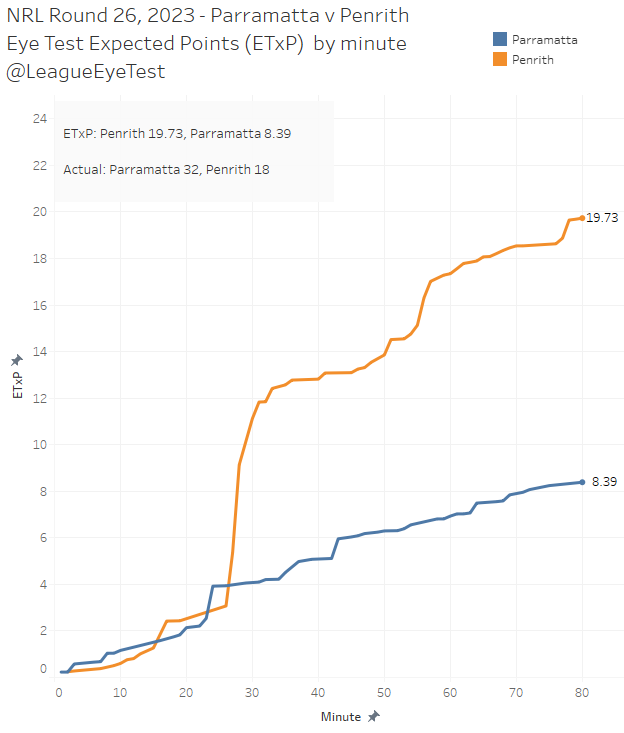
The crazy part about this chart is just how much possession the Panthers had. In the second half it was 57-43 to Penrith, and they led territory 65-35%, completing 18/23 sets whilst the Eels managed to complete at a decent clip but only had 16 total sets.
What that game showed more than anything, is how valuable Dylan Edwards is, and we’ll show some more of his value later.
The good news for Panthers fans is that it didn’t really affect their efficiency metrics, and they’re still dominating the NRL, even if they may not win the minor premiership.
Starting off our monthly efficiency checkup, here’s the plot of average actual points scored and conceded for context. All data is as usual from Fox Sports Stats.
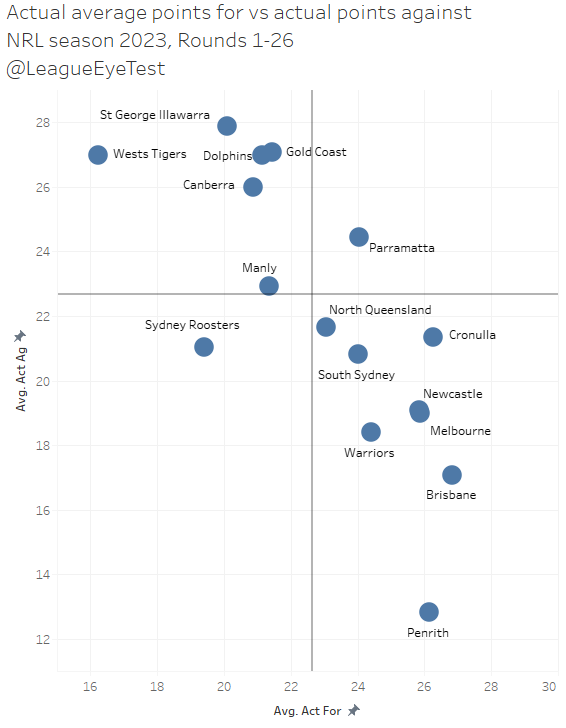
Penrith really stick out here, with the best defense in the competition conceding fewer than 13 points per game. The next closest would be Brisbane at a touch over 17 per contest. We can also see that Canberra again is defensively more in line with the bottom four than the top eight, something we pointed out a few weeks back.
Now we’ll check their expected points scored versus their expected points conceded. If you’re new to the site I’d recommend reading the explainer on the expected points model the Eye Test uses (ETxP), but the short version is that a point value is assigned to an area of the field based on the probability of scoring a try from that area of the field on a specific tackle.

Another outlier chart for the Panthers, highlighting just how good their control of field position is. They average almost 26 expected points per game, almost five more than the second placed Warriors. Simply, there is no other team in the competition that generates the volume of high value field position that Penrith does.
And defensively they’re just as good, only allowing 16.3 expected points per game, once again showing they keep their opponents’ out of high value field position. The only team that does it better than them is Parramatta, but they concede nearly 10 points per game more than the Panthers which is one of the reasons the blue and gold won’t be playing finals.
As usual, our next step is to check actual points scored against expected points scored as a measure of efficiency with the ball.
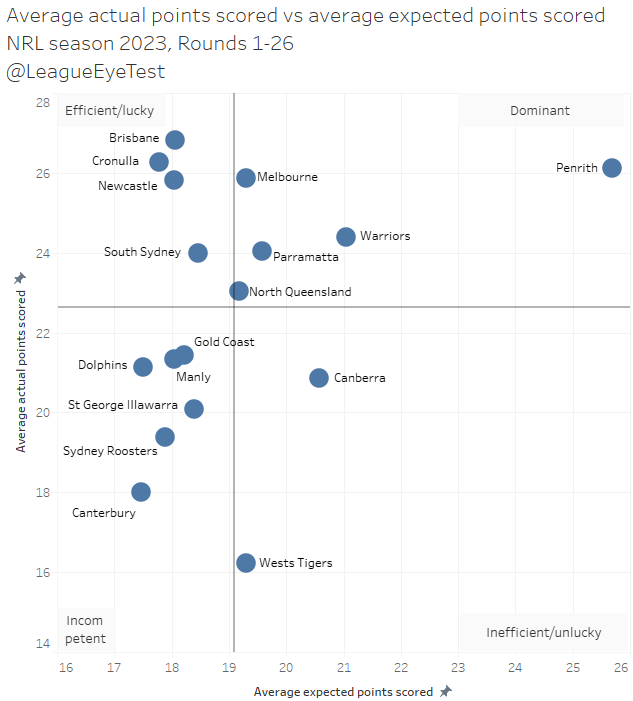
Another unicorn chart for Penrith, as they nearly match their league leading expected point totals. The only other team firmly in the quadrant is the Warriors, although Parramatta, Melbourne and North Queensland are straddling the borders.
Brisbane, Newcastle, Cronulla and to a lesser extent South Sydney occupy the “efficient/lucky” quadrant, whilst the Raiders and Tigers are the lone tenants of the “inefficient/unlucky” quadrant. This accentuates just how little they’ve been able to get out of the good field position they generate.
Actual points conceded against expected points conceded is our next chart.
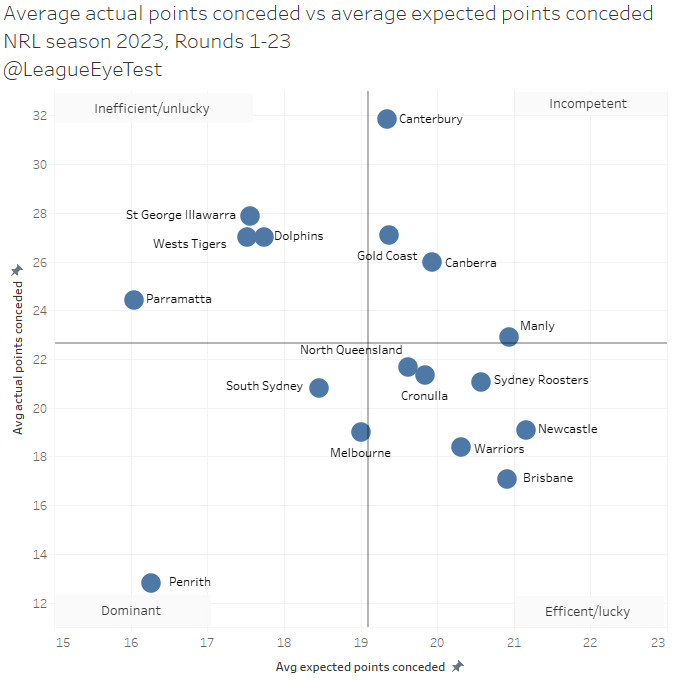
There’s the Panthers again, sitting by themselves in the “dominant” quadrant, as Souths are creeping towards the borders with their ordinary last few weeks. The Eels disappointing year is encapsulated here too, dwelling in the “inefficient/unlucky” quadrant, as they can keep teams out of good field position but allow them to score from those low point value possessions.
Now we’ll look at those last to charts as a percentage, to make some of these trends clearer. First up is percentage points scored over expected, where higher is better.

Brisbane, Cronulla, and Newcastle are all scoring at more than 40% above expected, showing how efficient they are with the ball. Penrith sits at just +1.7% above expected, and below the league average of +19%.
This looks like a poor result for Penrith until you look back at the previous chart showing they had generated almost 5 more expected points than anyone in the competition. They’re expected to be dominant, and they are.
And that domination extends to defense, where the same chart looks better for Penrith. For this chart, a lower number is better.

The Panthers are allowing 21% fewer points than expected, leading the NRL and well below the league average of 20%. Brisbane aren’t too far behind, conceding 18% points fewer than expected, but they give up some very high value field position and defend their line extremely well.
And here’s where the Eels fare the worst, giving up than 52% more points than they should be based on field position and possession. That puts them more in line with the bottom four than the top eight, somewhat like the Raiders.
And Newcastle’s strong defensive finish to the season sees them sharing a similar space to the Warriors defensively.
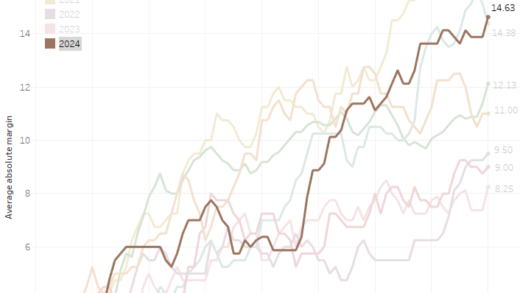
If we look at the minute by minute average margin charts, we can see Penrith is finishing games at an average of 13.5 points after 80 minutes this season, which is down on their 2021 and 2020 seasons but up on 2022 (12.75).
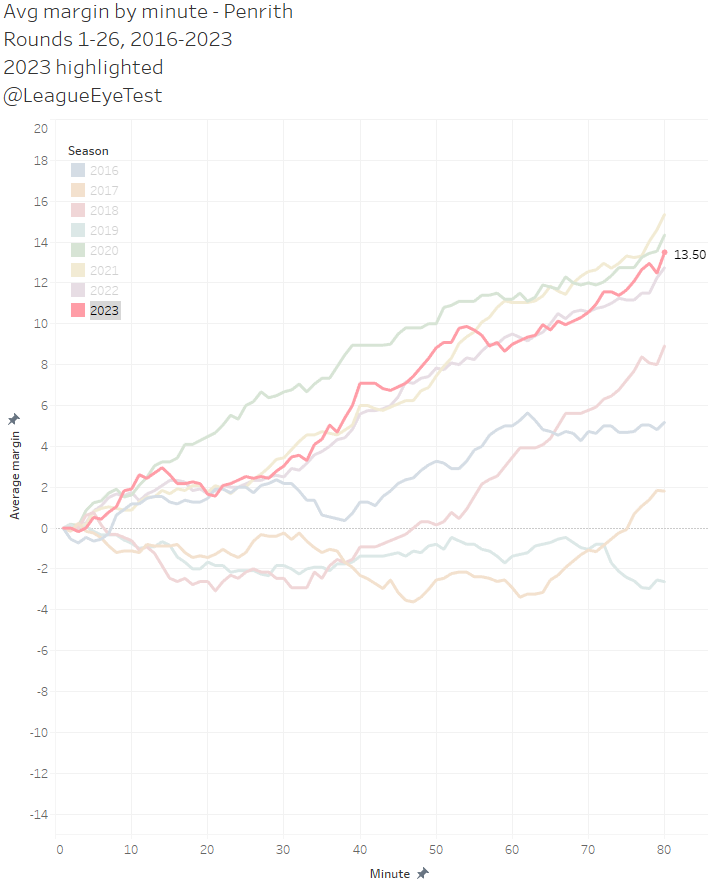
And like each of those seasons, they’re basically ahead on average margin after a few minutes. But unlike 2020, they don’t push ahead with an early lead. And unlike 2021 they don’t push on with a lead in the second half, but then 2021 was a “unique” season and probably should be riddled with asterisks.
This season they’ve been leading games in 59.5% of minutes played, which is the highest in the NRL this season.

The next closest is Brisbane at 55.5%, a full 4% or three full minutes of time leading. Although if we look at the last few seasons that 59.8% number is the lowest since 2020.

In 2020 they led for 72% of minutes, followed by 61% in 2021, 66% in 2022 and now 59.5% this season. Again, they’re dominant, but they are looking less dominant than they have been previously. They’re still in a class of their own, but the gap is narrowing.
If you’ve watched the Panthers play over the past few seasons you’ll know how much of their game is based around possession of the ball. And their heat maps show it. Below is a heat map of every Penrith play the ball this season.
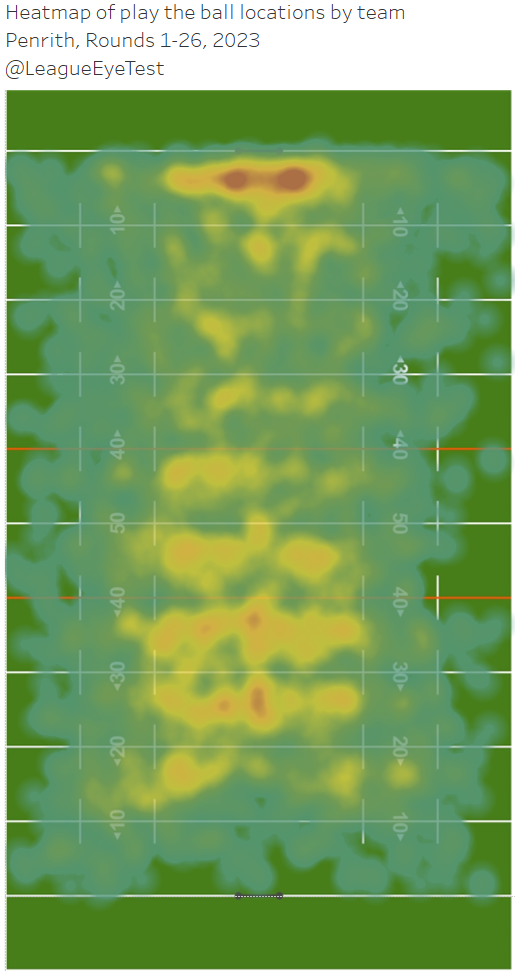
It’s easy to see how Penrith just set up shop on either side of the sticks once they get close to their opponents goal line.
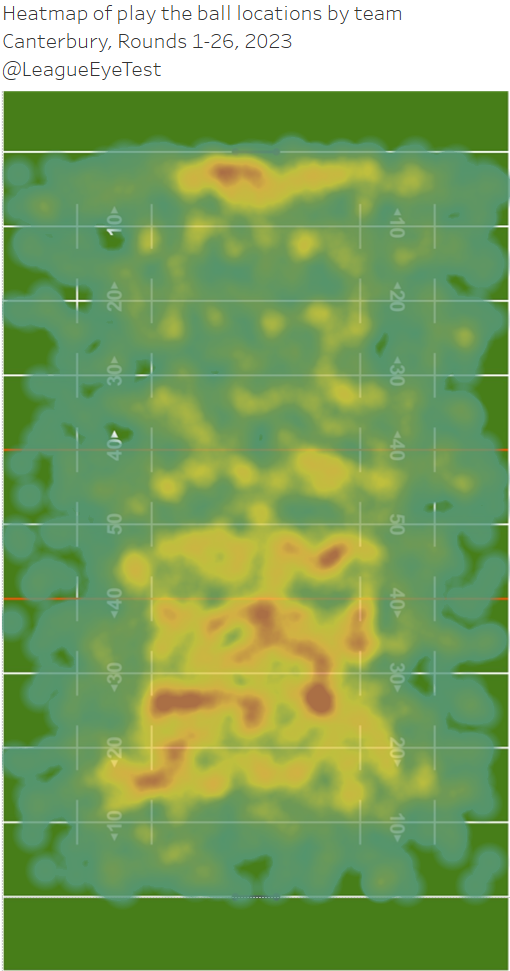
You’ll also noticed just how few high intensity spots in red are in their own half. For reference, here’s the heatmap for one of the worst sides in the competition, Canterbury.
And here is where we get to the value of Dylan Edwards. If you check the average starting position of tackle one for the Panthers, they’re starting at 40.7 metres downfield.

Only the Titans are better at 41.0 metres. The ability of Edwards, and to a lesser extent Brian To’o and Sunia Turuva, to provide a great platform for them to start their sets from cannot be understated. The absence of two of them on Thursday evening was telling.
And if you account for how much time they spend inside their foes red zone, once play the balls inside 20 are removed they’re first at 32.6 metres out, over 1.5 metres further than the Dragons who place second.
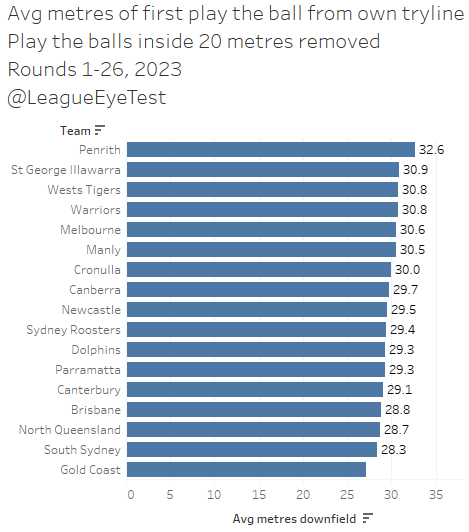
There lies the importance of Dylan Edwards to the team. For all the snide remarks about empty stats, it’s clear he’s a vital part of the side.
And if we look at the Panthers opponents heat map, you’ll see almost the exact opposite trend.
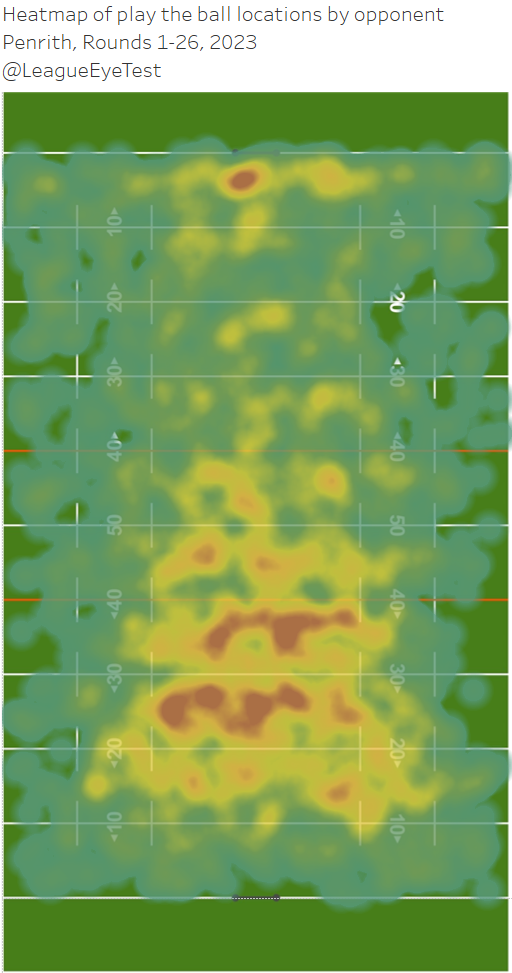
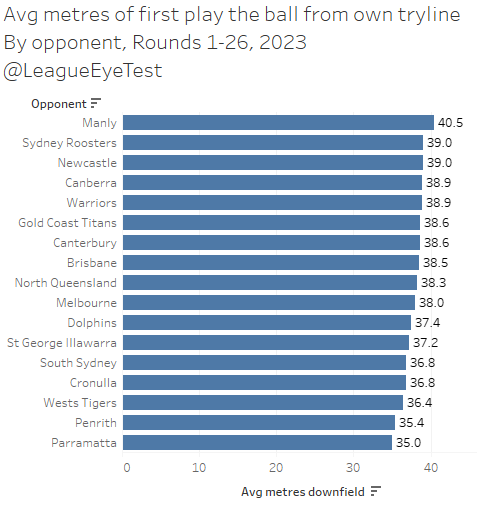
Teams spending a stupid amount of time in their own half, and very little inside the Panthers 20 metre zone. Panthers opponents start just 35.4 metres from their try line, the second lowest in the NRL behind Parramatta, who rank first thanks to Mitchell Moses’ unrivaled long kicking game.
It’s no surprise that teams spend over 60% of play the balls inside their own half when facing the Panthers.

It’s not hard to see why from the next chart. Penrith are ranked 1st, 3rd, 5th and 1st on metres past the play the ball on tackles 2 through 5. Making metres from them is like getting blood from a stone.
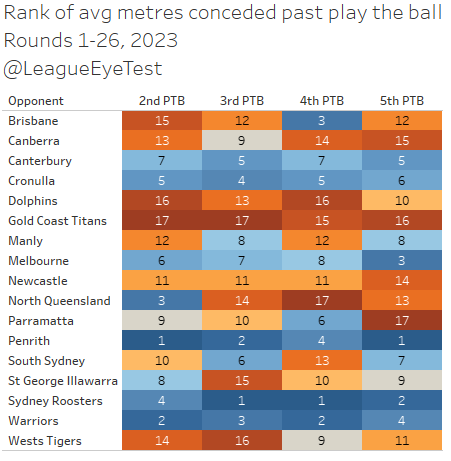
They allow just 9.19 metres from the 4th play the ball to the 5th. For reference, the Eels allow 11.36, the worst in the NRL. This means that every 5th play the ball Parramatta give up over 2 metres more than the Panthers.
The interesting thing about Penrith is that they don’t make metres, but there’s an obvious reason why. Here’s the breakdown of rank by team of average metres past the play the ball per tackle.
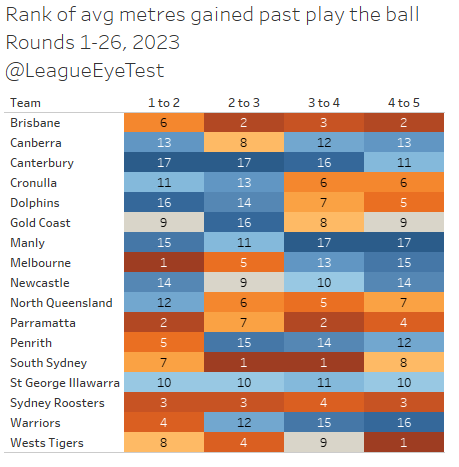
Penrith’s best is from tackle 1 to 2, where they are ranked 5th. But on the following three play the balls they’re ranked 15th, 14th and 12th.
Part of the reason is that Edwards gives them an incredible starting point, and his value to the team only increased as he sat out this week. Another reason is because as we saw before, they spend so much time close to their opponents’ line. If you’re regularly 5 metres out, it’s hard to make more than five metres past the play the ball. Their ability to get in high point value positions hurts their performance in this metric, but any team would make this trade off.
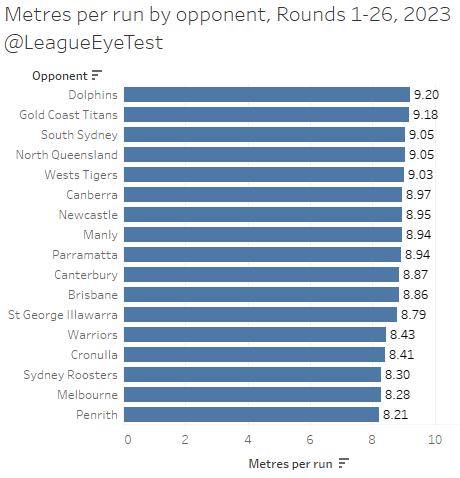
Overall the Panthers metres per run conceded is the best in the NRL at just 8.21 allowed per carry.
If we split it out into pre-contact and post contact metres per run, they’re also first in pre-contact metres per run.

And second best in post contact metres allowed per carry.

It’s not just line speed, the Panthers don’t buckle through contact either, allowing just 2.72m after contact, only bettered by the Sea Eagles.
As an aside you might have noticed that Manly are 17th for pre-contact metres per run at 6.33 but 1st in post contact metres per carry at 2.62. A very unique combination.
You can see how dominant Penrith are, and why it doesn’t matter if they don’t make a lot of metres. They defend well and control possession. Which is shown in their net metres per run (gained minus conceded).

Their net metres per run allowed is great this season, but was above 1.1 metres for the past two seasons.

And looking back to 2019, they’ve had three of the best four seasons for net metres per run.

Penrith has two of the three seasons where a team has made more than 1 metre per run than their opponent, although two of them came form that 2021 season. They also have three of the top four seasons by this metric.
When you add in that they’ve got the safest hands in the NRL as well, it’s an incredibly tough assignment. Penrith has the best error rate (average number of touches per error) in the NRL this season and has done so for the past few years, this year only committing an error every 53 touches of the ball. The next nearest is the Warriors at 45.4, meaning the Panthers average seven more receipts per error than their closes rival.
If a team like the Panthers is allowed to have so much possession and rarely make a mistake, it’s very tough to beat them. You either need to be perfect or catch them on a scarce off night like the Eels did.
And they have for multiple seasons. Here’s a plot of average possession per game plotted against average errors, by team and season since 2020.
The path to another Penrith title might look a lot less certain than it was a week ago. The return of Edwards will certainly help, and the assumption would be that Luai returns at some point during the finals. Even without Luai’s return you’d still be hard pressed to pick the field over Penrith, despite their low effort outing against the Eels on Thursday.
There are teams with the tools to beat Penrith this season, as Brisbane and the Warriors have excellent defensive records, and there may not be a more dynamic team with the ball than the Broncos.
However, there’s a big difference between teams that being able to beat them and actually executing a game plan to do so. It’s the latter that the Panthers have been unmatched in for the past three seasons and they look likely to continue doing so.