
The NRL 2020 regular season has drawn to a close and much like the Brisbane Broncos it is time to get to the bottom of it. Statistically that is.
There were some significant rule changes this season that have impacted the way teams are playing. The biggest ones were the move to one referee and the introduction of six again calls for ruck infringements, which I’ve gone over extensively before.
The other less talked about one was the change to provide attacking players the same protection under high kicks that defensive players have received. This change has certainly played a part in how teams are attacking at the end of sets, with a sizable increase in kicks aimed between 1-10 metres out from the try line instead of trying to place the ball in the in goal area. It has also resulted in some teams, most notably the Melbourne Storm, just running the ball on the last tackle to hand it over a few metres out, rather than have a mistimed kick result in a seven tackle set from the twenty metre line.
Just how much did those rule changes affect the way the game looked statistically? To check how much things have changed, we’re going to look at the percentage increase on a per game basis from the average of all 25 rounds in 2019 to 2020 from Round 3 to 20, for groups of publicly available statistics from Fox Sports.
If you read my breakdown of the Warriors statistical improvement under Todd Payten from earlier in the season, you’ll know why I’m just using the percentage change and not the raw number change. If not, then the reason is that it’s hard to show per game shifts in statistics with massively different ranges. You can show the change in run metres from 2800-2900 per game, but you would never see the change in average metres per run from 8.92 to 8.85. To deal with that I am purely looking at the percentage change, which for most statistics is in the single figures to low double figure range, which allows for a greater distinction of change.
Now we’ve defined what we’re looking at, what changed under V’Landysball in 2020? And by how much? Turns out quite a bit.
Time in play
The biggest change was time in play. With around 22% fewer penalties being called, the ball wasn’t sitting idle as long and time in play jumped by 6% (golden point games excluded from each season). You can see the round by round breakdown and three round rolling average (orange line) below.

The average time in play increaed by 6% from 54.15 minutes to 57.73 minutes. A lot can happen in three minutes in the NRL, although from the statistics below most of it seems to be middle forwards running the ball. The interesting thing was the decline in time in play late in the season. Rounds 3-12 had an increase in time in play of 9.6%. Yet Rounds 12-20 only had a 1.6% increase. Something to investigate…
Possession
Moving on, these rule changes had a flow on affect to practically every other single statistic in the game. More time in play means more possession. More possession means more runs. More runs mean more run metres. Which leads to more kicks at the end of sets. More tackles need to be made. And so forth.
It does mean that anyone averaging a “career high” this season that is less than a 4-6% increase is probably not having a career high if you adjust 2020 stats to be in line with 2019. That doesn’t mean they haven’t had a career season by effort, just that their numbers are slightly inflated and not completely comparable to previous season without adjustment.

Looking at the above chart, the orange data points show the 2020 percentage change, and you can see that average sets per game are up nearly 8%, as are average play the balls (+7.47%) but average tackles per set is basically flat (down 0.4%). This is no surprise with the increase in early kicks seen this season.
Completion rate also increased slightly, up 2.4% to 78.3% per game from 76.5% last season, pointing to a slightly more conservative approach despite the increase in tries and points scored.
Penalties and set restarts
As you’d expect with the significant rule change this season, here’s where you see the most changes and it’s had a flow on effect to other parts of the game. There was also the removal of one referee.
Penalties declined by 22% with the introduction of set restarts. This led to a large number of them being called in the first half and a one third drop to the second half as seen below.

Consistency of set restart calls in the second half has been an issue for the second half of the season. We had a run of 6-7 rounds where games had zero set restarts in the second half, and then we had Round 19 where three of the four highest second halves for set restarts occurred. It’s something that needs to be tightened up for 2021.
Scoring and passing

Thanks to some high scoring final rounds of the regular season, scoring increased almost in line with the increase in time in play or possession, increasing 5.78% per game to 41.74 points per game, up from 39.5 per game last season.
Tries were up 9.78%, goal attempts were up 1.8% while goal makes were down 2.1%. Part of this is probably linked to the decline in penalties with set restarts being introduced, as penalty goal attempts are down 32% this season on the back of penalties awarded declining by 22%. As penalty attempts were usually taken in positions where the goal kicker was likely to succeed, it makes sense that the overall percentage would decline.
Line breaks increased at a lower rate than tries, at just 4.72%, which makes sense after you read the kicking analysis.
It is interesting that the increase in possession and time in play hasn’t led to an increase in general passes, which were only up 1%. We’ll see why though in the analysis of runs and running metres. Offloads were down by 5%, again supporting a theory that coaches were playing a more conservative game. That is also shown with errors being basically flat on last year, from 21.7 to 21.5 per game.
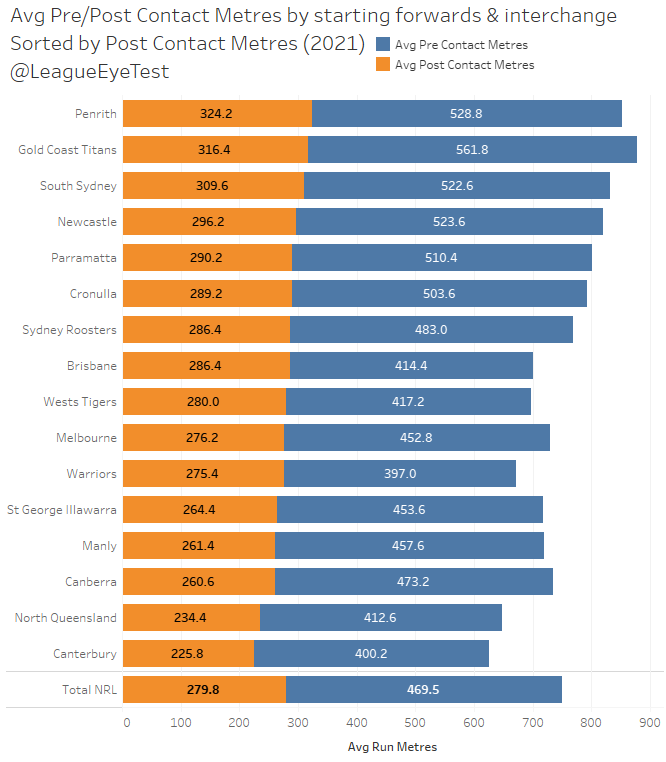
Running and metres

As you’d expect with more time in play there’s been an increase in runs, up 4.6% and total run metres are up 3.8%. The interesting thing with run metres is how we’ve arrived at that increase. Post contact metres are up 3%, while pre contact metres are up 5.4%, leading to a decline in average metres per run from 8.92 to 8.85. It’s not a lot but when you consider there’s been over 50,000 runs this season it does add up.
The type of runs has seen a big change as well, with dummy half runs down just over 9% on last year, dropping from 17.6 to 16.0 per game. This has mostly moved to one pass runs, a standard hit up, which has increased 7.3% to 155 per game from 145 per game in 2019. These numbers would explain the higher increase in pre contact metres and a slightly lower metres per run, and the decline in passing and offloads as mentioned above.
Again, this points to a more conservative approach, which again leads into the next section. Set restarts are also having an effect here, as when the tackle count restarts, they continue to push the ball through the middle.
Kicking stats

One of the biggest changes this season was in kicking type. Overall kicks have increased by a similar amount to runs and run metres, up 3.9% to 18.2 per game. When you drill down into that, you can see that long kicks are up 11.5% and attacking kicks have increased by 5.7%, while weighted kicks are down by a huge 25%, which you can see by the orange data point on the left. I’ll quote my theory from the Round 14 Notes and Trends post as to why that is the case.
“Here’s my crackpot theory – teams have gotten more efficient and accurate at aiming their attacking kicks just outside the goal area to avoid a seven tackle set. The rule change which came into effect in Round 1 that gives airborne attacking players the same level of protection as airborne defensive players is surely a driver for this, as Daniel Tupou was showing before succumbing to injury.
This explains the drop in weighted kicks but the large increase in attacking kicks. Fewer kicks reaching the in-goal area leads to fewer dropouts which can take up to 45 seconds each. By aiming them a bit shorter than the try line, at worst a team will give up possession less than 10 metres out or a scrum at the same point. This is a much better result than a seven-tackle set from the 20 metre line.”
The Melbourne Storm were one of the teams driving this drop in weighted kicks, as I noted earlier in the season. They were quite happy to run out the ball on the final tackle and ensure their defense was set well inside their opponents 20 metre zone.
There’s been a decline in forced dropouts as well, down from 3.33 to 3.28 (-1.5%), and fewer kicks going dead (-6.9%) which also supports this trend. The reduction in dropouts taken has also led to part of the increase time in play, it’s not purely the cause of set restarts.
I mentioned before that line breaks hadn’t increased at the same rate as tries, and one of my theories is that there are more tries being scored from attacking kicks, which aren’t awarded any line breaks.
Defensive stats

Not a lot has changed in the few defensive statistics publicly available, with tackles up just 3.2%, and missed tackles climbing by 2.5%. Tackle efficiency, which is a cautious stat to be using in the first place, barely changed, sitting at 92.41% last year and 92.46% this year, which is why you can’t see the orange data point.
When you bring all these small changes together, it shows a change in the way the game has been played. We’ve seen more ball in play thanks to the change to set restarts for ruck infringements. This has led to an increase in hit ups through the middle of the field, and a further neutering of dummy half running. The law of unintended consequences led to conservative one out running with little ball distribution becoming a larger part of the game.
This has been offset by the dramatic change in kicking profiles, with teams favouring attacking kicks within the 10 metre zone. This has come at the expense of short weighted kicks that are aimed to sit up in the in-goal area and draw repeated sets of six. Coaches have become even more risk adverse, happier to hand over the ball a few metres out instead of potentially giving up a seven-tackle set from the twenty metre line.
Given the gravity of the changes made this season, hopefully we’ll see a more nuanced approach to rule amendments in 2021.
Final set restart update
Hopefully, this is the last time I have to write something about set restarts for at least a month (*notes Grand Final date*). After Round 20, we had one of the lowest numbers of total infringements called since Round 4, with a penalty or set restart being called approximately every 22 play the balls.

On the positive side, there was a bit more consistently among whistleblowers this round, even with the wacky rule changes that were being used. I would have bet my house that Andrew Gee would have given at least 15 once they let him call them for offside.

And that restraint has ensured that Gee didn’t finish the season with an average of 10 or more set restarts called per game. He did manage to call four more per game than Chris Sutton though. There’s always next season Andrew.
Final Error Rate update
I’ve been posting Error Rate updates throughout the season, and with the regular season finished it’s a good time to reflect on 2020 and see who had the worst hands in the NRL this year.

I had planned to put more than a two-game minimum to qualify for this list, but with Nene McDonald making six in just two games, I stopped at a minimum of three errors required. McDonald’s rate of an error every five times he touched the ball and three every 80 minutes is horrific.
Only slightly less horrific is North Queensland’s Shane Wright at one every 7.8 possessions and the Tigers Asu Kepaoa at 8.3 possessions per error.
Not that it seems to be causing the Roosters many problems, but Josh Morris the highest profile name on this leaders list, with an error every 9.88 possessions. Of 28 NRL players who have made at least 20 errors, only one of them has fewer possessions. That would be another Tigers back, Tommy Talau, who has 20 errors in 206 possessions for a rate of 10.3.
Final NPRF update
And finally, as this is the last (regular) post for the season we’ll finish on a high with the full season look at Net Points Responsible For (NPRF).

Nathan Cleary hangs on to first place at +9.72 net points per game responsible for. Luke Keary and Shaun Johnson round out the top three, but the big story is Cody Walker charging into fourth spot after his amazing game against the Roosters on Friday.
Jarome Luai has also had a fantastic month to close the season and takes fifth spot at +6.0 NPRF per game, equal with Cameron Smith and Jahrome Hughes. You can see the impact AJ Brimson has had for the Gold Coast as well, averaging 4.0 NPRF per game.
Here’s the bottom 20 for the season with a minimum of five games played.

Brisbane’s Jesse Arthars holds the worst NPRF per game this season, giving up 5.33 points per outing. Manly’s Albert Hopoate (-4.80) and the Bulldogs Christian Crichton (-4.50) make up the remainder of the bottom three.
Eels fans won’t be surprised to see Blake Ferguson sitting on this list either, especially after his defensive lapses against the Tigers, at a stone cold -3.16 per game.
If you enjoyed this post please consider supporting The Rugby League Eye Test through one of the links below.
Scan the QR code or copy the address below into your wallet to send some Bitcoin to support the site Scan the QR code or copy the address below into your wallet to send some Ethereum to support the site Scan the QR code or copy the address below into your wallet to send some Litecoin to support the site Scan the QR code or copy the address below into your wallet to send some Bitcoin cash to support the site Select a wallet to accept donation in ETH BNB BUSD etc.. Donate To Address
 Donate Via Wallets Bitcoin
 Ethereum
 Litecoin
 Bitcoin cash
Support The Rugby League Eye Test
Support The Rugby League Eye Test
Support The Rugby League Eye Test
Support The Rugby League Eye Test
Donate Via Wallets


1 Response
[…] One of the outcomes of the introduction of set restarts after Round 3 in 2020 was an increased time in play, which artificially inflated a lot of numbers and not necessarily in a good way. It claimed to speed up the game, but mostly just resulted in more “stuff” happening in the middle of the field. […]