
The last few seasons has produced a lot of talk about how the Sharks are flat track bullies, or have had a soft draw, or can’t win against quality competition when it matters. The results tend to agree with this, and the only way for the club to shed this sort of moniker is to deliver finals victories.
It was an issue back as a far as 2020 when former coach John Morris had to field questions about the fact his team hadn’t beaten a top eight side all season. There was plenty of talk last season about their soft draw.
And in 2023, they’ve only beaten one side currently in the top eight this season, which was Parramatta in Round 2 when the Eels were sitting 16th after starting 0-2.
Even Andrew Johns came out this week and claimed that Dally M winner Nicho Hynes needed to put in big performances in important club games. The noises are coming louder and louder, and the sub par first half effort against the Wests Tigers this round didn’t help.
Which begs the question, just why are the Sharks unable to dominate top eight sides the way they do the bottom half of the competition?
I’m not going to focus on their record against top eight teams, their record in such games is already well known and partly due to the draws they’ve been handed. What I want to focus on here is how they play and what might be different when they face stiffer competition. I’m interested in the process not the results.
To do this we’re going to look at the Sharks team statistics for the past four seasons (2020-2023) against teams inside the top eight and against those in the bottom eight (nine for 2023). Please note that that this is the ladder position at the time the game was played, not the end of season ladder position. As usual all numbers are from Fox Sports Stats.
First we’ll take a look at their margins after 80 minutes over the course of these games. We know they’re less successful against Top 8 sides, but this will help us pinpoint if there’s any differences when they face lesser opponents. Here’s 2023 highlighted where you can see a trend, even if it’s a small sample size.
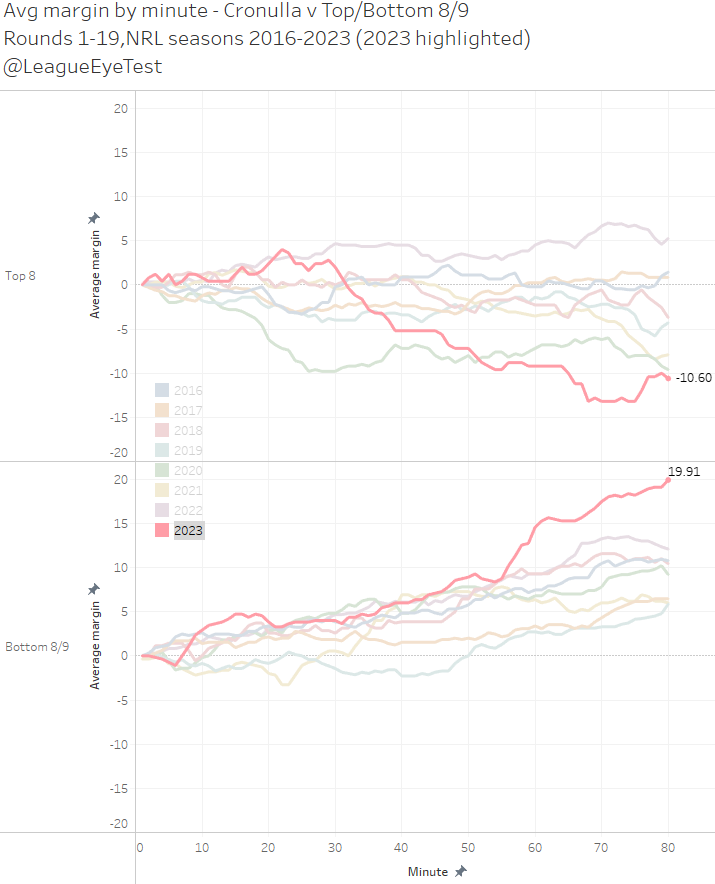
The most glaring thing about the way the Sharks play against the top and bottom sides is that they reach a point in either game where they feel the result is inevitable and either kick on or pack it in. Some of the Top 8 line for the Sharks this year is influenced by their Round 15 disaster against Melbourne but the margin line follows a similar trend without it. It just ends up around -3 points per game instead of -10.6
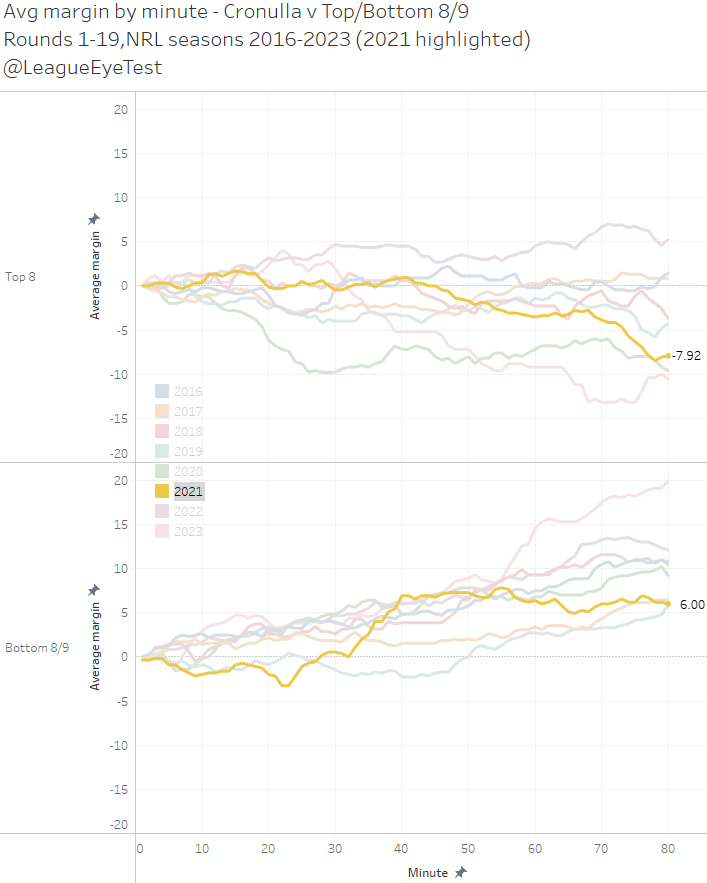
And to show it’s not just a recent trend, here’s the 2021 line. +6.0 points against Bottom 8 sides after 80 minutes, and -7.9 against Top 8 sides.
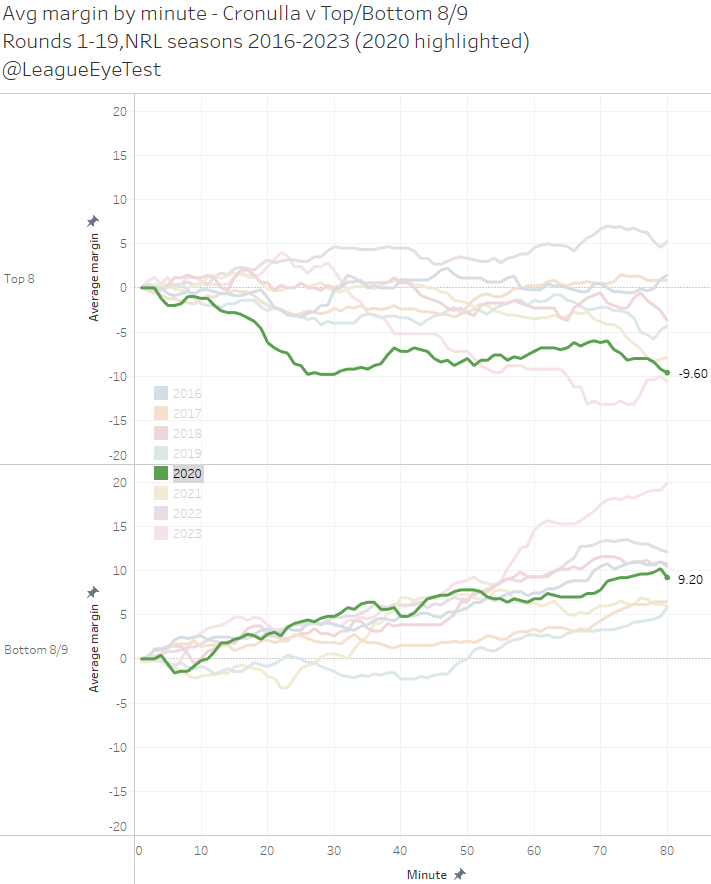
2020 Looks familiar as well. +9.2 against the Top 8, and -9.6 against the Bottom 8. 2019 is a similar story with a -4.3 average margin after 80 minutes against the Top 8 sides and +5.9 against the Bottom 8.
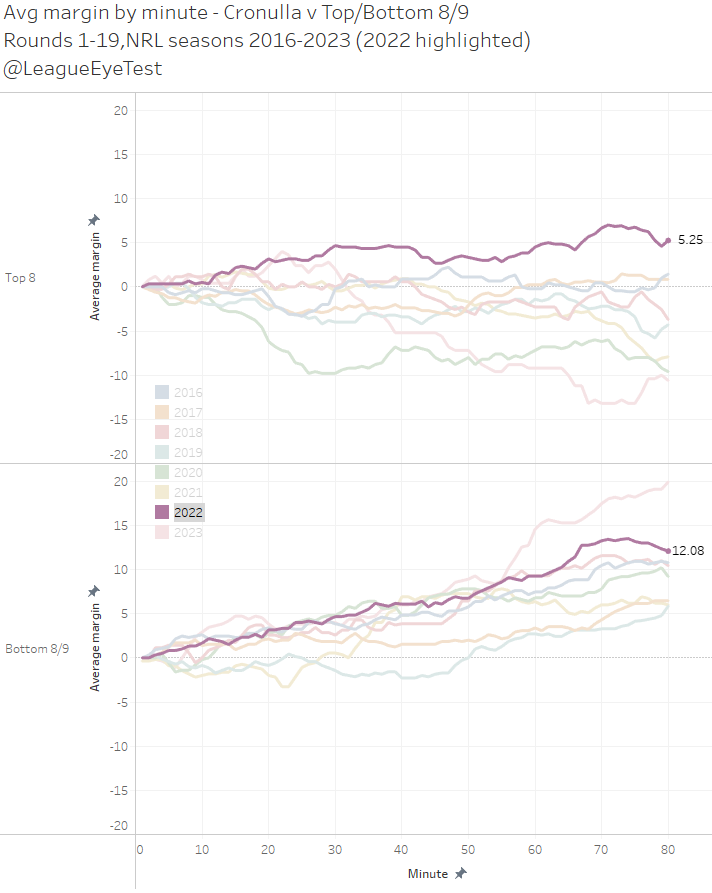
Only 2022 (dark purple line) has some semblance of a team that puts in for the full 80 no matter who they face. But they still had a margin that was cut in half when facing a team in the Top 8. They ended up 12.1 points ahead after 80 minutes against the Bottom 8, and only 5.3 ahead of Top 8 sides.
So why does this keep happening? A lot of it appears to come down to metres per run gained and allowed.
Since the 2020 season , Cronulla average 35cm more per run against bottom 9 sides. Below is the year by year breakdown and it might show why 2022 was a bit of an outlier.
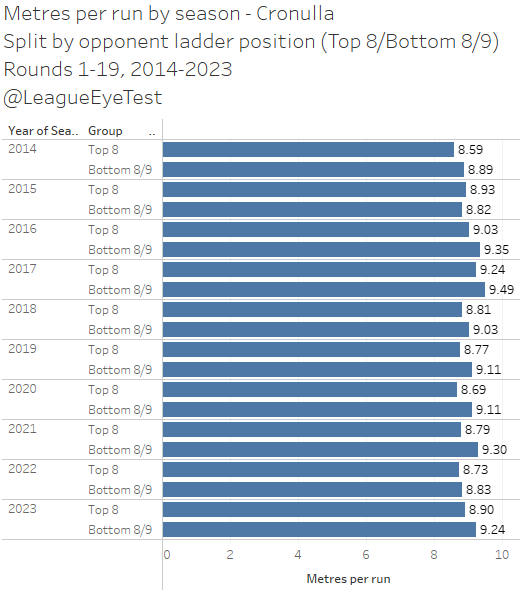
You can see the trend here in the last few seasons. Against Top 8 sides the Sharks don’t push the ball downfield as much. In 2020 it was 8.69 metres per run against Top 8 sides, and 9.11 against Bottom 8. Most of the difference for Cronulla is in post contact metres, which makes sense when they’re facing weaker opposition.
These aren’t anything out of the ordinary – good teams run the ball better against weaker competition. But it’s not the numbers here that are the issue, and we’ll get to that shortly.
Last week’s June efficiency update showed that the Sharks are one of the most efficient teams in the competition. They outscore their expected point totals by over 50%, which means that they don’t need high point value possession near the line to generate points.
If we split their attacking efficiency, we get an interesting story. Overall Cronulla is at +56%, and here’s how it looks against Top 8 and Bottom 8/9 sides.
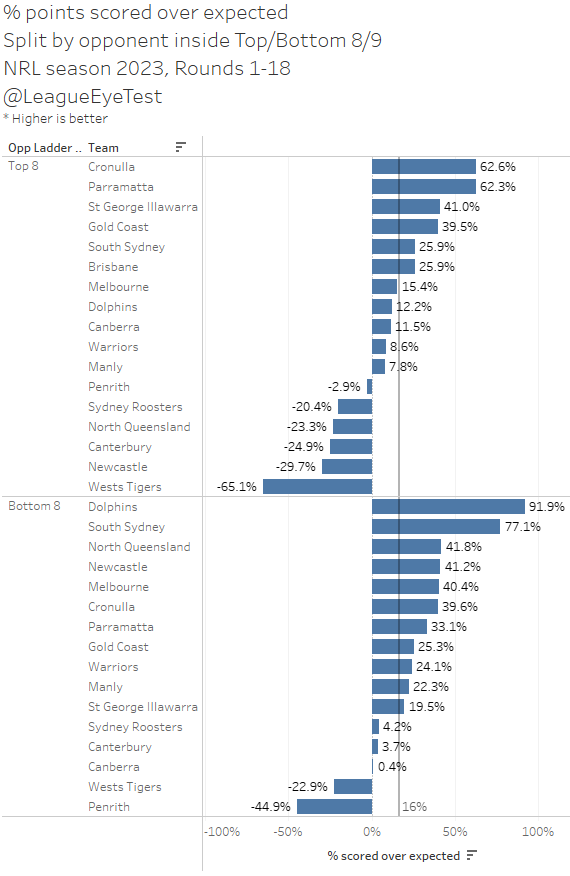
Surprisingly they’re still quite efficient against Top 8 sides at +63%, indicating that even against the good sides they’re still able to post points with lower quality field position. And against the bottom half of the NRL they’re +40% which ranks them 5th.
The problem comes defensively where since 2020 they allow half a metre more per run to Top 8 sides playing them than they do to those out of finals contention.
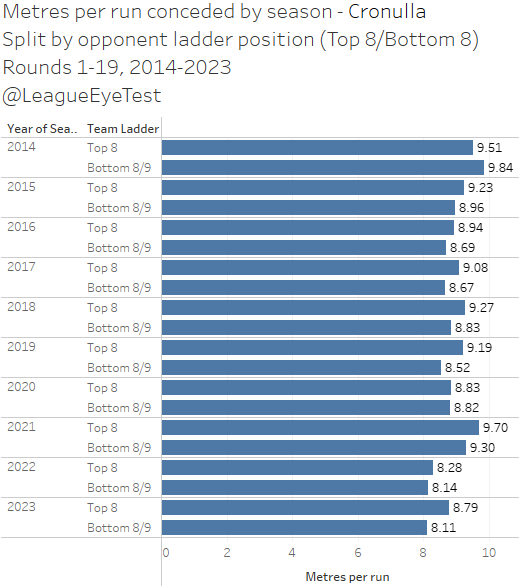
Top 8 sides playing the Sharks in the past four seasons have averaged 8.98 metres per run, whilst Bottom 8/9 sides average just 8.58. And in what should give coach Craig Fitzgibbon some sleepless nights, the difference is 0.68m for 2023 after values of 0.14m and 0.40m in the prior two seasons.
When they play a strong side, over 80% of the that difference per run comes from pre contact metres, which implies could be a line speed issue in those contests with Top 8 sides.
And here’s the kicker, at least for 2023. In last week’s June efficiency post I highlighted how strong Souths were at making metres past the ruck on tackles 2-5, and how strong the Warriors were at defending metres past the ruck on those tackles (keep this number in mind for later).
From that chart the Sharks were in the top half of the competition in metres gained between play the ball locations (not run metres), and mid table on conceding that distance. Except for tackle 1 where they were 15th.
Now what happens if we split this data by performances v the top 8 and bottom 9 and rank the clubs?
Here is the crux of the issue. This is why I said the number itself was not the issue and it’s not pretty reading for Sharks fans. Against sides in the bottom 9 spots, they’re no worse than 8th ranked by metres past the play the ball, and are 5th, 4th and 5th past the second tackle. Most teams would be happy with those ranks as it puts them firmly in the top half of the NRL.
But the shocker is that against a team inside the Top 8 at kick off, they’re ranked 17th, 17th, 15th and 17th in metres past the play the ball. This is small sample sizes if you look at match count as they’ve only played four games in such a situation. But from those games that’s almost 500 play the balls which is plenty of data to draw a conclusion from.
Bluntly the Sharks couldn’t push their way out of a paper bag against stronger teams. Their average metres from the first to second play the ball locations are just 5.03. The only other team with sub six metre number is the Dolphins who make just 5.99 on second tackles against the top 8. After that it’s Manly at 6.12. Cronulla aren’t just bad on second tackles against teams inside the eight, they’re diabolical and no one else is in their ballpark.
Third tackles aren’t much better, where they make only 6.9 metres. South Sydney make 9.45 metres between the same play the balls, and the Sharks themselves gain 9.23 against bottom 9 sides.
Defensively it’s a similar tale. Here’s the same chart but showing metres conceded between play the balls instead of gained.
They do rank 3rd for metres made from second to third play the ball locations, which is a testament to their kick chase and ability to set their line quickly. But for tackles 3-5 they’re 15th,14th and 11th. Against bottom 9 sides they’re ranked 3rd, 5th and 7th respectively. Clearly, they have no issues dominating the minnows of the NRL but facing a more formidable foe they appear to wilt.
Their defensive efficiency doesn’t share the same trend as their attacking one either. Below is the same chart from before but this time showing the percentage points conceded over expected points split by Top and Bottom 8/9.
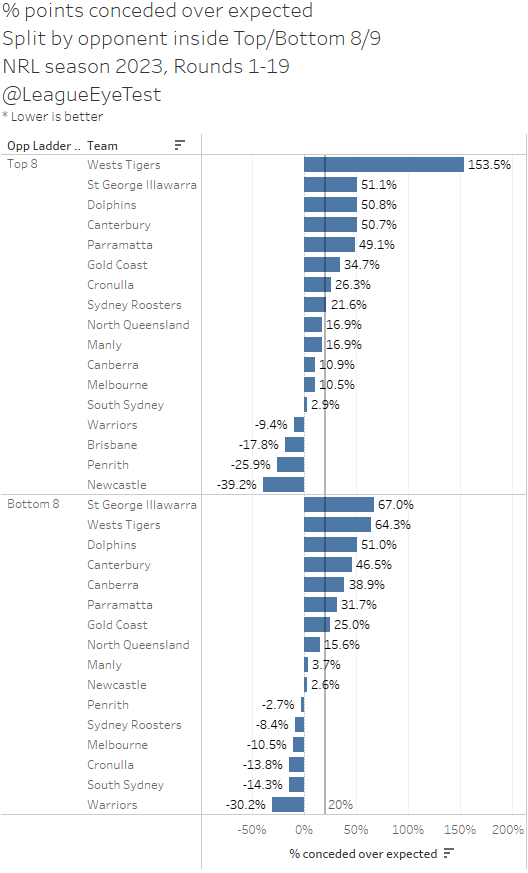
Against bottom 8/9 sides Cronulla is one of the best in the league, conceding 14% fewer points than an average team would score given the same field position and possession. That number ranks them third in the NRL, only behind South Sydney and the Warriors.
But against stronger teams that number rises substantially to +26% (keep in mind lower is better on this chart), which is sixth worst in the league. It indicates that the Sharks are allowing top eight sides 26% more points than an average team would score given the same field position and volume of possession.
It’s even clearer if we look at the average location of each play the ball for teams facing Cronulla this season, split by Top 8 and Bottom 8/9. Games against positions 1-8 are in orange and those against 9-17 are in blue, with the number in the box corresponding to the play the ball number. Apologies for the overlapping tackle numbers but I think it still conveys the point.
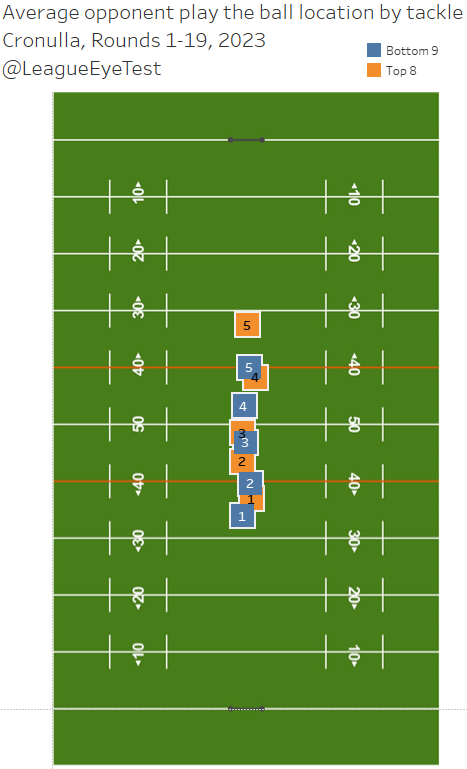
Top 8 sides have their first play the ball about three metres further up field than Bottom 8/9 sides to, the former starting at 36.8 metres and the latter at 33.8. As the set progresses you can see where the issue lies.
Cronulla opponents inside the Top 8 are five metres further downfield on 4th play the balls and almost 7.5 metres further downfield on 5th play the balls. That latter number is crucial, because it means the difference between an attacking play 40 metres out and one that’s inside pushing the 20 metre zone.
The only team in the NRL that has a worse gap between last tackle play the balls for Top and Bottom 8/9 sides is Brisbane, and as we alluded to a month ago their goal line defence has been impeccable, something you can’t say about the Sharks when they play a Top 8 side. Their metres past the ruck conceded doesn’t match the profile of a top eight, let alone top four side.
With the ball, the numbers and play the ball positions are pretty similar for Cronulla.
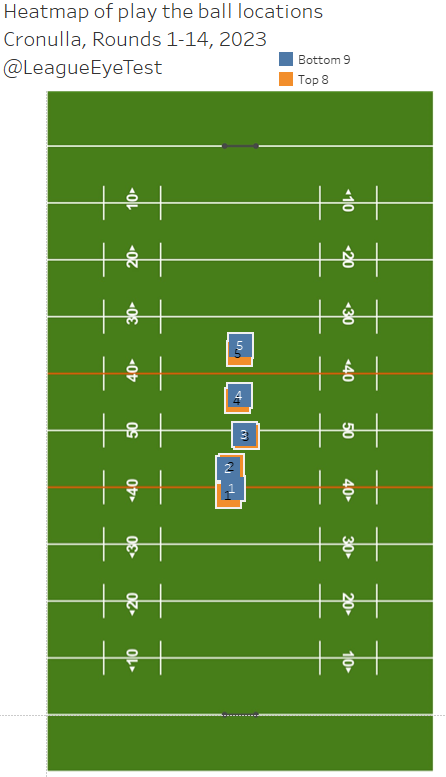
These positions speak to the Sharks efficiency against weaker teams, and why they struggle to score at the same rate against quality foes. But it also shows why the struggle against quality sides, as they don’t advance the ball as far but let their opponents do so.
Looking at their players Eye Test Player Contribution Rating (ETPCR) numbers against Top 8 and Bottom 8/9 sides also highlights their issues. Below is every Sharks player with at least 10 appearances since 2020 split by games against Top 8 and Bottom 8/9 sides.
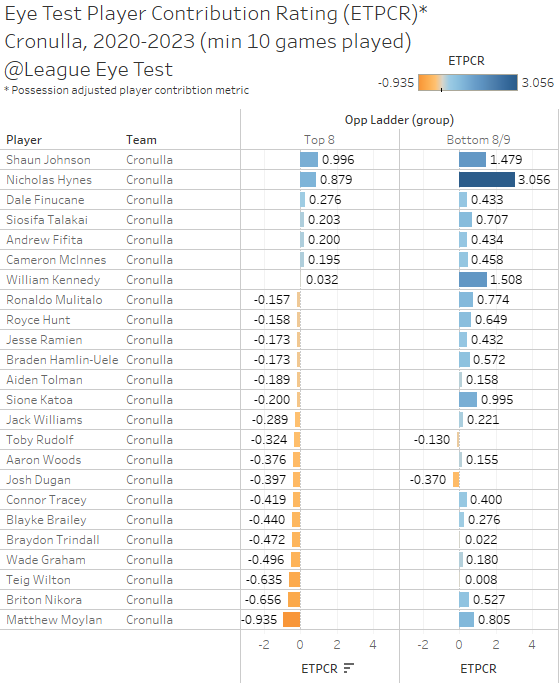
Here it should be quite obvious where a lot of the issues are. There’s only a handful of players who had a consistently positive ETCPR against both groups, and two of them are no longer playing there (Shaun Johnson and Andrew Fifita). The others are Dale Finucane, Siosifa Talakai and Cameron McInnes.
Nicho Hynes is still a positive against Top 8 teams, but his number drops from +3.056 to +.879 when facing teams in eighth spot or higher.
The rest of their side reverts to average or below. ETPCR is weighted so 0.0 represents an average NRL player – however a negative score doesn’t necessarily imply a bad player. The number is derived from statistics that correlate highly with winning games, and some positions like centres and wings will have a negative position average as the majority of tries are through them.
Back to the Sharks, The biggest drops are outside backs and edges. Will Kennedy drops from +1.508 to +0.032. Briton Nikora falls from +.527 to -0.656. Sione Katoa and Ronaldo Mulitano had similar declines. Matt Moylan goes from +0.805 to -0.935. Even their middles like Royce Hunt, Braden Hamlin-Uele and Toby Rudolf declined.
No other top eight side has as many players fall from a positive ETPCR to a negative one by splitting their matches against top and bottom 8 sides. It shows they have a few consistent players, but when they face a top four or top eight side, more than half the list goes missing.
If you’ll recall, I mentioned that you should keep the Warriors solid defence in mind for a reason – they’re playing the Sharks in Auckland this round. Which means we have the best yardage between play the ball defence against Top 8 sides in the NRL playing the worst metres gained between rucks against Top 8 sides in the NRL.
Last time they played it was a 32-30 victory to the Warriors via a last minute penalty goal to Johnson. This was a game where the Sharks led 26-12 at half time and was a great example of how the Sharks can outscore their field position easily, but struggle to contain top eight sides.
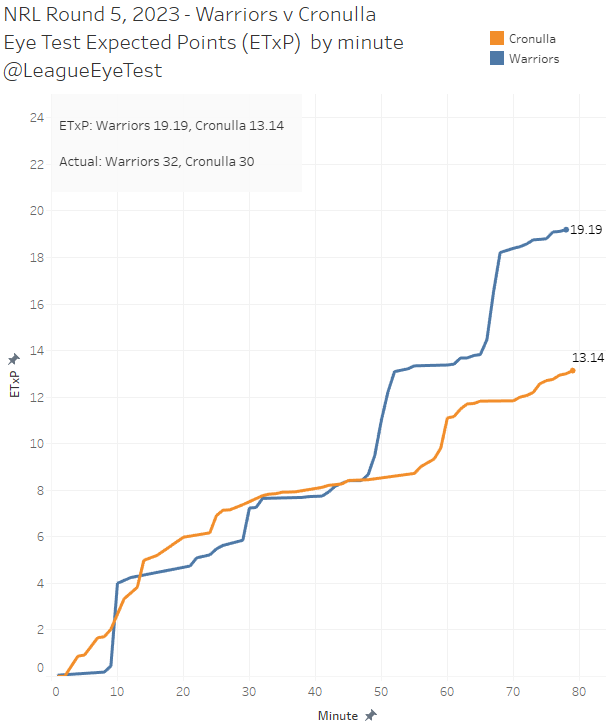
Looking at the expected point chart above, Cronulla only had 13.14 points worth of possession, but still scored 30 themselves. But they allowed the Warriors possession worth 19.2 points, over half of that in the second half alone which led to them being run down. If you’re going to be as bad as the Sharks are at letting Top 8 sides run the ball, the last thing you can do is give them significantly more possession.
This game is the start of a run for the Sharks where they can define their season. They still have games against Penrith (1st), South Sydney (8th) and Canberra (5th) to come, and the latter two have already beaten them this season. There’s also a game against the Cowboys in Round 25, and by then they may have improved on their 9th position and could sit inside the Top 8 given their current run of form.
If Cronulla want to be considered competition heavyweights, they need to fix their yardage conceded against top four sides. Time is running out this season to change this habit, and history suggests it’s been an issue across multiple coaches and playing rosters. Fitzgibbon will need to get the team to buy in defensively, like Andrew Webster has with the Warriors, if they want to win games in September.

This is a fantastic piece of analysis even by your very high standards. I have made a small contribution to show my appreciation. Please keep up the great work