The first half of the 2021 NRL season is over already. Time sure does fly, unless you’re a Raiders fan, and then it probably doesn’t move quick enough. With the passing of the midpoint, it’s time to look back at what has transpired and see what has changed thus far.
Fatigue has been the main talking point this season, with the NRL claiming there is no link between the rule changes and fatigue. I figured it was a good time to take a broader look at how fatigue and injuries has changed minutes played and players used in 2021.
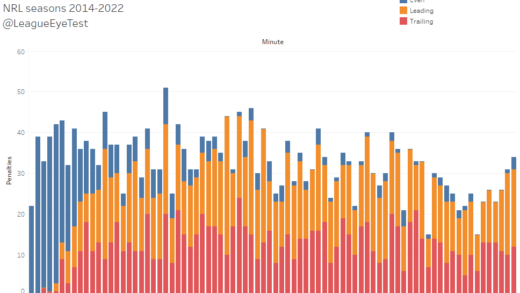
Earlier this season the Eye Test already looked at how teams were using their interchange bench more often, and earlier in games. With fewer stoppages, greater fatigue impact and more line-up changes, it is no surprise that teams who excel in recruiting outside of their own back yard or prioritise developing their own juniors are excelling this season.
Let’s start by looking at a simple measure – the average minutes played by an NRL player.
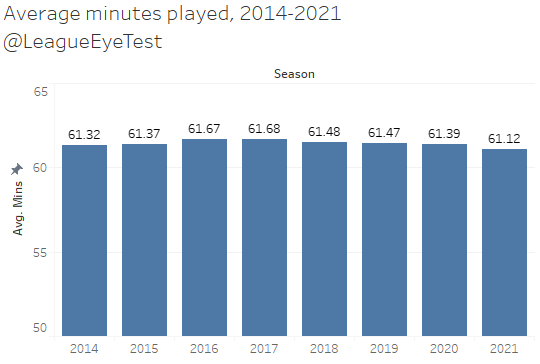
Over the past eight seasons players about 61 minutes per game, with 2021 sporting the lowest average at 61.12 minutes, beating the previous low in 2014 of 61.32. This makes sense with the number of injuries and head impact assessments, as players who would usually be playing big minutes are spending more time off field.
Notice the average minutes played hasn’t changed much from 2020 to 2021? It’s down but only by a small margin. Keep this in mind for later.
If you look at the change in minutes played by position, you can see why the minutes played has dropped but hasn’t altered significantly.
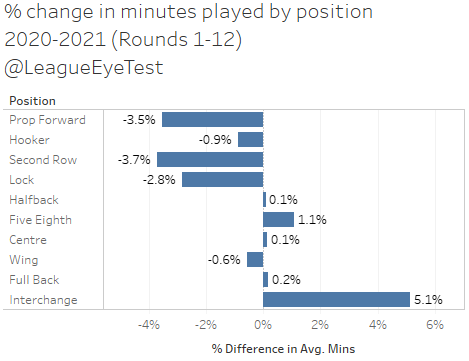
Most starting forwards are playing fewer minutes, with front rowers, second rowers and locks all playing around 3% less than last season. This has been made up by interchange players, who are spending 5% more time on field, which makes sense given the number of injuries and reduction in stoppages.
The decline in mintues makes sense, given that there has been a high number of players injured and undergoing a HIA most likely due to the reduction in stoppages from poorly thought out rule changes.
Which raises the question, has that affected how many players each team has used this season? The number of unique players used each season is below. For comparison purposes, 18th men have been excluded.
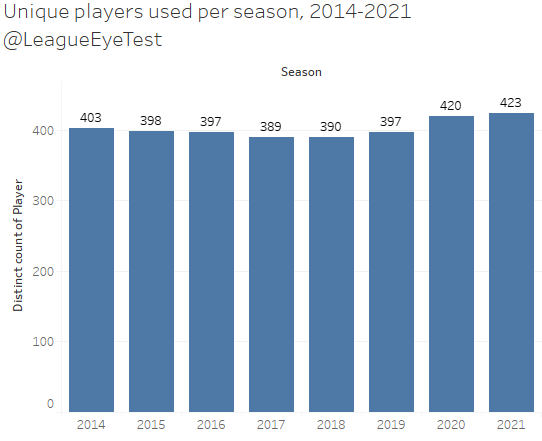
Here we can see some of the affect of the “fewer stoppages” era of the NRL. 2014 was the only time in the previous eight seasons where over 400 unique players had stepped onto a field in the first twelve rounds. The jump from 2019 (397) to 2020 (420) was about a 6% increase. For those who like to claim that there isn’t enough talent to support a 17th or 18th team, we’re using an extra team of players each season due to attrition under the current environment.
Next up I’ve split this out by team for 2021, to understand which teams have coped the best with the increased fatigue, and who has struggled.
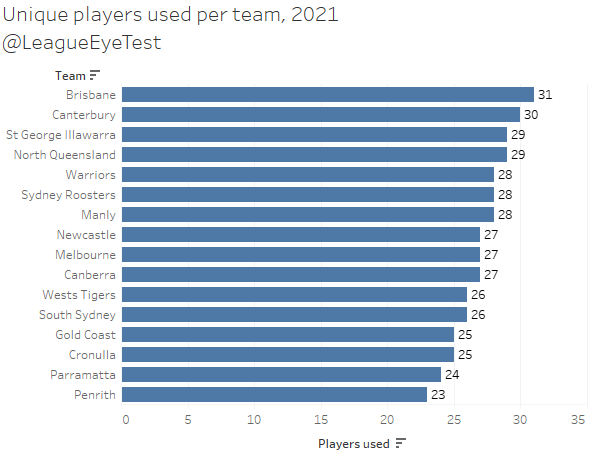
No surprises that Penrith and Parramatta have been the least affected by line up changes this season. Those at with the most changes have been brought about by injuries (Roosters, Warriors), suspensions (St George), reshuffles (North Queensland) or a combination of all three (Brisbane, Canterbury).
Moving back to the unique players used, those 423 unique players have played 3,255 games. Of those games, 1,533 players have played at least 80 minutes, or about 47%. How does that stack up historically?
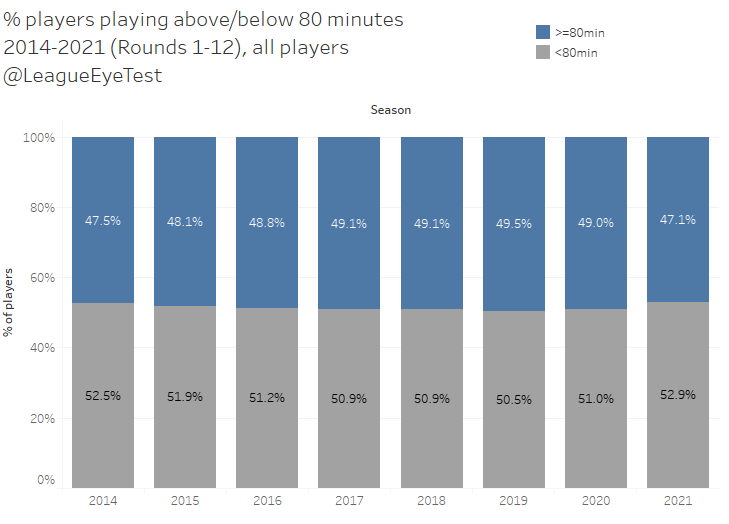
Unsurprisingly, again it’s the lowest percentage of players playing 80 minutes since 2014, and nearly a 2% drop from 2020 when set restarts were implemented in Round 3. Coaches are finding they cannot leave players on the field as long as they used to, whether that be due to injury or fatigue leading to bad decisions. Keep in mind that some players are being forced to play 80 minutes because there were no available interchange players due to injury.
Even more alarmingly, backs (numbers 1-7) are playing the lowest percentage of full games since 2014 as well, at just under 89% of players hitting 80 minutes.
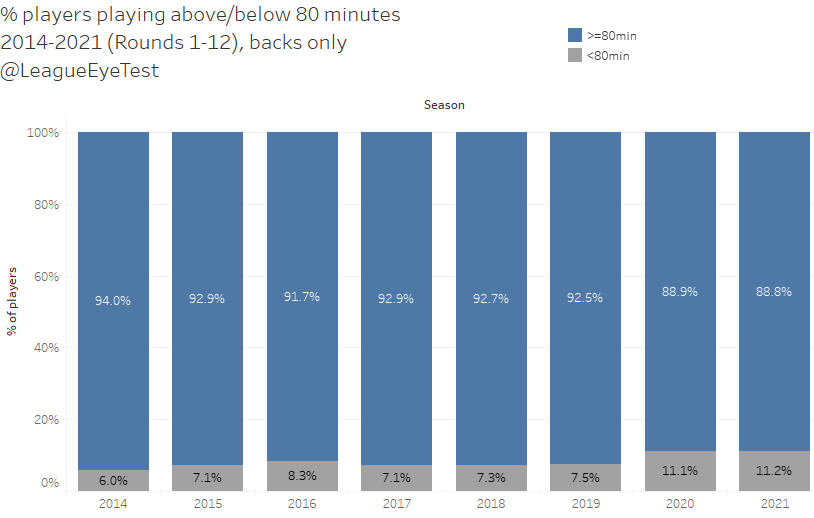
After only once hitting 8% prior to 2020, we’ve had two seasons of the percentage of backs not playing 80 minutes above 11%. Over one in ten backs are now not playing the full game. Regardless of the reason, whether it be concussion, injury or getting hooked, backs are playing fewer minutes than previous seasons.
The last thing I’m going to check is the distribution of minutes played to check for any trends. Below is a box and whisker plot, which can be used to show the spread and a five number summary of a set of data. The numbers are the minimum, first quartile (25%), median, third quartile (75%) and maximum. Here’s how the distribution of mintues over the last eight seasons looks.
The thing that stands out from looking at minutes is that the median (middle number in a set of data) is considerably lower in 2021 than 2020, or any other year in this set. Last year the median was 77, meaning that half of the all players up to Round 12 played at least 77 minutes. This season, it’s down to just 71 minutes, which is almost a 10% change in one season. Yet as I mentioned before the average was similar (61.39 in 2020 to 61.12 in 2021).
The third quartile hasn’t changed much, and at 41 minutes is in line with other seasons, confirming what we discovered earlier, that fewer players are playing the full 80 minutes and it’s dragging down the median. Those minutes are being distributed to interchange players who are spending more time on field and the average is masking the change. It’s also why you don’t use averages in your press releases to unsuccessfully quell player unrest.
It’s pretty hard to argue now that players aren’t being affected by fatigue this season, with fewer playing 80 minutes, interchange player are spending more time on the field and a larger percentage of backs aren’t playing the full game.
The NRL can use whatever unrelated metrics they like to show that things are working. but as a wise man once said, “the kind of people swayed by statistics are generally not swayed by bad statistics and have keen enough noses to smell dumb shit a mile off”.
Being concerned about player welfare and not being a fan of the current rules aren’t mutually exclusive. Unlike those with a predisposed agenda, the Eye Test is agnostic and only relies on facts.
Net post contact metres
Post contact metres are often used as a barometer for success for NRL teams, as run metres correlates highly with winning games. But how do you judge if a team won that battle? Gaining 600 metres post contact sounds good, unless you’re giving up 700m.
The answer is to look at their net post contact metres. Net post contact metres is derived by taking a team’s post contact metres and subtracting their opponents post contact metres.
The chart below shows all 16 NRL clubs and their net post contact metres over the twelve rounds played this season, with a line showing their average net post contact metres for 2021.
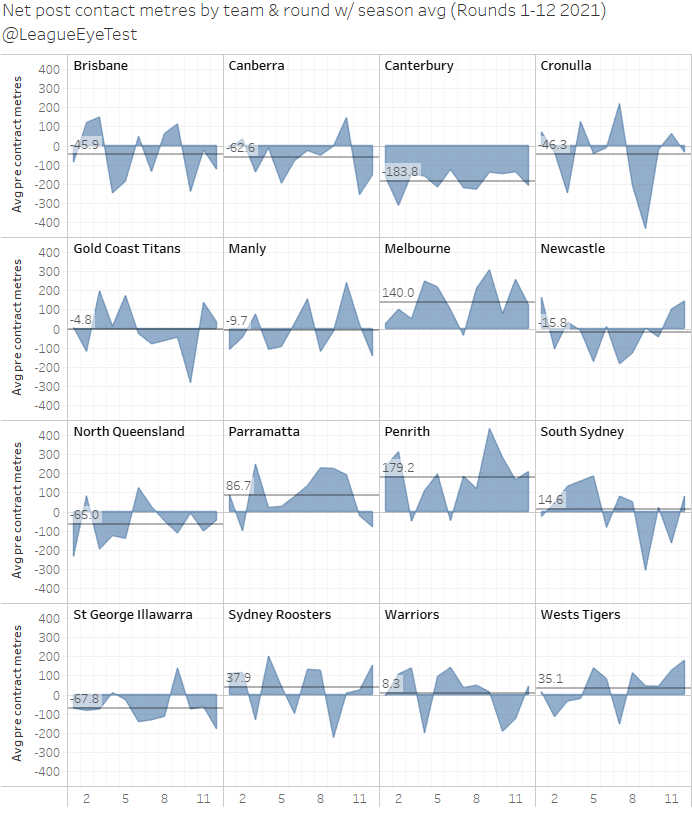
There are a few reasons I like this chart, which I used last season as well. The first is that I can see every team at once. The second is that it clearly shows who is performing well (Penrith, Melbourne), and who is struggling.
Canterbury haven’t had a game with positive net post contact metres all season and are giving up an average of 180 more to their opponents. Melbourne, on the other hand have only lost one post contact metre battle all season, which came in Round 7 against the Warriors in a game they won.
The third is that it’s great at showing the ebbs and flows of a team over a period of time. Parramatta’s success over the past two months can be seen before screeching to a halt in the last two rounds against Manly and South Sydney. The Raiders struggles can be seen as well, coming out on top only a handful of times.
It also shows that despite the Dragons strong start to the season wasn’t sustainable as they didn’t win a single post contact metre battle during that time. They have only come out on top once this season, which was Round 9 against the Bulldogs, who everyone comes out on top against.
To’o’s rise to Origin
The naming of Panthers winger to the New South Wales State of Origin team this week ruffled a few feathers, with detractors pointing to his lack of heigh compared to Daniel Tupou as a liability at that level of the game.
It may be the case, but if you compare the two players statistically this season there’s no doubt To’o is ahead of Tupou but not by a wide margin. Tries per game is the one metric where the Roosters winger comes out ahead.
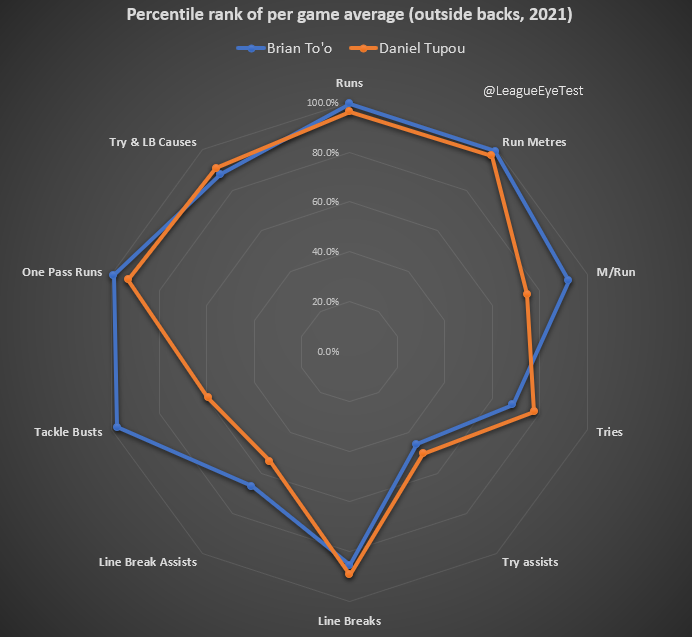
The main difference is the incredible work rate and damage To’o does when running the ball. I’ve posted the next two charts a number of times but given his selection it’s worth revisiting them.
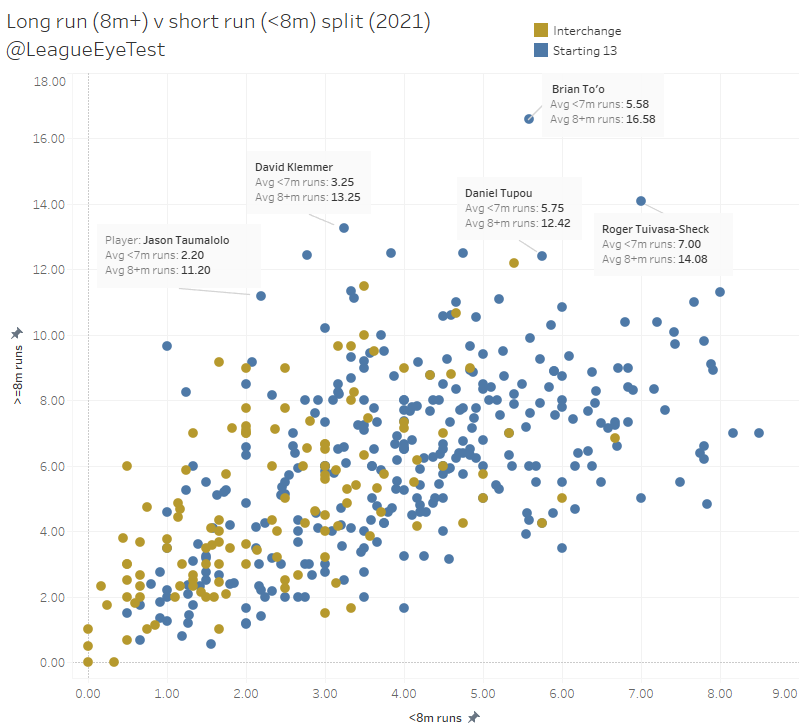
To’o is still blitzing the rest of the league in long runs (greater than 8 metres), with 16.6 per game. That’s almost as many total runs per game as Tupou has (18.2).
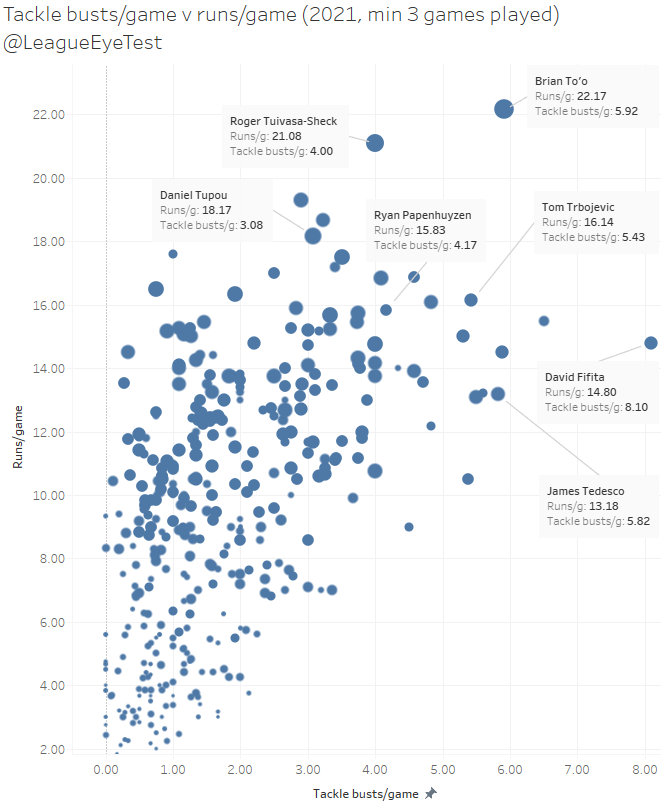
He’s also busting nearly twice as many tackles as Tupou as seen below.
With the fast past of State of Origin set to be even faster this season with the new rule changes, having someone with the work rate and explosive ability holding the ball that To’o has could be an important factor in spelling the Blues back when they’re gassed.
If you enjoyed this post please consider supporting The Rugby League Eye Test through one of the links below.
Scan the QR code or copy the address below into your wallet to send some Bitcoin to support the site Scan the QR code or copy the address below into your wallet to send some Ethereum to support the site Scan the QR code or copy the address below into your wallet to send some Litecoin to support the site Scan the QR code or copy the address below into your wallet to send some Bitcoin cash to support the site Select a wallet to accept donation in ETH BNB BUSD etc.. Donate To Address
 Donate Via Wallets Bitcoin
 Ethereum
 Litecoin
 Bitcoin cash
Support The Rugby League Eye Test
Support The Rugby League Eye Test
Support The Rugby League Eye Test
Support The Rugby League Eye Test
Donate Via Wallets