Round 1 of the 2023 National Rugby League season is in the books and there’s so many positives from the weekend that even Peter V’Landys couldn’t ruin. Everyone managed to find something to enjoy about the slate of games, especially Dragons fans who managed another week’s reprieve before having to suffer through another Hook coached season.
We were treated to some enthralling games and close finishes the likes of which were rarely seen in a whole season, let alone a whole round. Funny that rugby league is more engaging when the teams the scores are closer because teams aren’t fatigued.
One of the biggest takeaways for me was just how close and competitive the round was. The average margin after 80 minutes was just 8.25 points, which was one of the most competitive rounds since 2016. If you’re wondering why that’s not the same as the 8.8 number the NRL put out on Monday, it’s because I’m just using the 80 minute number, removing Golden Point from the Eels/Storm opener. Apples to apples comparisons.
Unsurprisingly, with the addition of a second Brisbane team and a slew of close results the viewership for the round was through the roof.
If you compare it to every Round 1 since 2017, it’s the lowest opening round average absolute margin since that season. I don’t have data going back that far, but the NRL has confirmed that’s the lowest average margin since 2012.
That 8.25 points is about 1 point fewer than 2022, and well over half of the opening round from the cooked 2021 season where the average margin was 17.9 points for Round 1. Half time margins were the lowest since 2016 as well at just 5.5, down from 5.75 a year ago. Below is the minute by minute chart of average absolute margin for the past seven seasons, with 2023 highlighted.
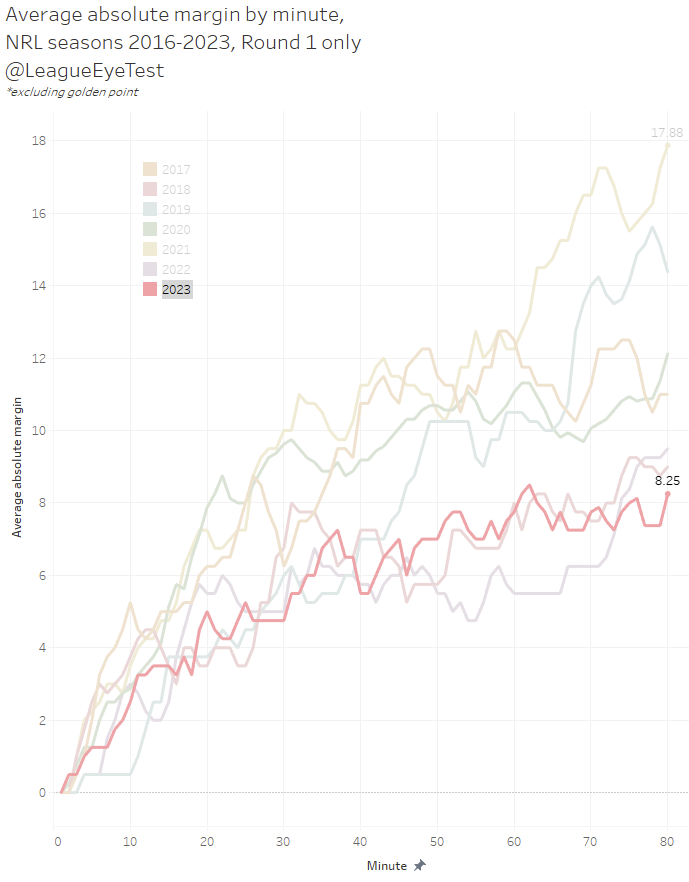
The games were close throughout the whole contest as well. The average absolute margin didn’t peak over 8 until the 60th minute, where it hit 8.25, then dropped under 8 until the 76th minute when it reached 8.13 and then finally 8.25 in the 80th minute. That’s a minor change from 2022, where games passed the 8 point margin in the 74th minute and pushed over nine by the end of the second half.
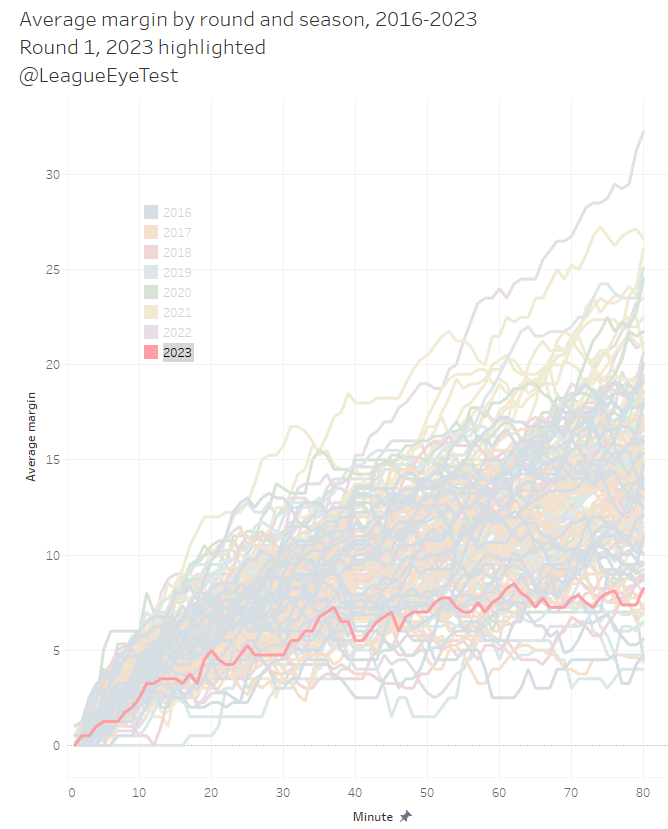
And to put things in more perspective, here’s how Round 1 2023 looks compared to every round from the past eight seasons.
Looking at how much “garbage time” was played in Round 1, where scores were more than three converted tries apart (margin of 19+), only 2.6% of minutes on the weekend played under that definition, the second fewest since 2017. One third of minutes were played with scores between two converted tries (7-12 points), the highest since 2016 and almost 19% of games were played where the score was even. That was 4% highest than the previous best, 14.6% in 2018.
Why did this happen? On the surface it looks like defenses were better prepared and teams with the ball spent more time bring the ball out of their own area.
There were about 6% more play the balls this season than last year’s opening weekend. The percentage of those play the balls inside a teams own half was up to 58%, by far the highest of the first round of any season since 2014, over 2% more than the previous high in 2020. The share inside an opponents 20 metre zone was just 19.2%, also down from over 20% two seasons ago.
Players were also making fewer metres per run – just 8.41 metres per carry in Round 1 opposed to 8.62 twelve months ago. And the drop was mostly from post contact metres. Pre contact metres fell by just 3cm to 5.79m per run, whilst post contact dropped by 17cm from 2.80 in 2022 to 2.63m in 2023.
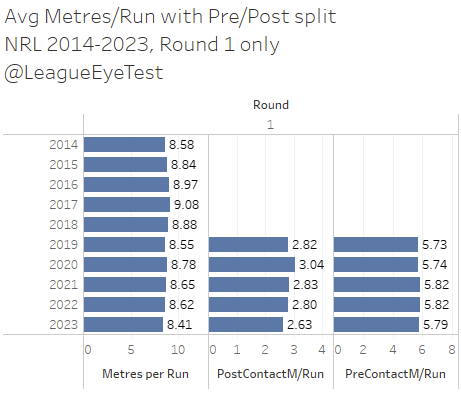
Players are hitting the line (pre-contact) at a rate similar to previous seasons, but they’re not making it as far after contact, the lowest rate since the statistic was introduced in the late 2010s.
A difference of 17 centimetres may not sound like a lot, but over the course of 135 play the balls during a game that can add up to an additional 20+ metres per side per game.
Trying to predict anything from early season statistics is fraught with danger (something I’ll try and look at in the coming weeks), it could have just been the perfect storm of evenly matched teams still trying to work out combinations. But from the returns in Round 1 it looks like defenses might be starting to regain some control of the game back.
Do the Roosters hate the sun?
I hate to deal in small sample sizes but I saw this one mentioned on Twitter and had to look into it.
It doesn’t seem to go back past last season, but there is some evidence of it lately.
Since Round 1, 2022 the Roosters have played eight regular season games in a daytime timeslot (2pm, 3pm, 4pm). Those results are:
- 20-6 loss to Newcastle
- 22-14 win over the Warriors
- 14-12 loss to St George Illawarra
- 31-24 win over Parramatta
- 22-16 loss to Canberra
- 54-26 win over St George Illawarra
- 32-18 win over North Queensland
- And finally, a 28-12 loss to The Dolphins yesterday
That’s a 50% win rate when the sun is out for kickoff (4-4), compared to nearly 70% (11-5) when they play in a twilight or evening game.
Looking at things a bit closer, their completion rate in daytime losses was 71%, whilst in the four wins it was 81%. Contrast that to their performances in games starting 5:30pm or later, where they complete at 76% in losses and 75% in evening wins. Again, small sample sizes but some intriguing results.
Interestingly they played five daytime games in the 2021 regular season and won all five of them by an average of 14.4 points and a completion rate of 78.4%.
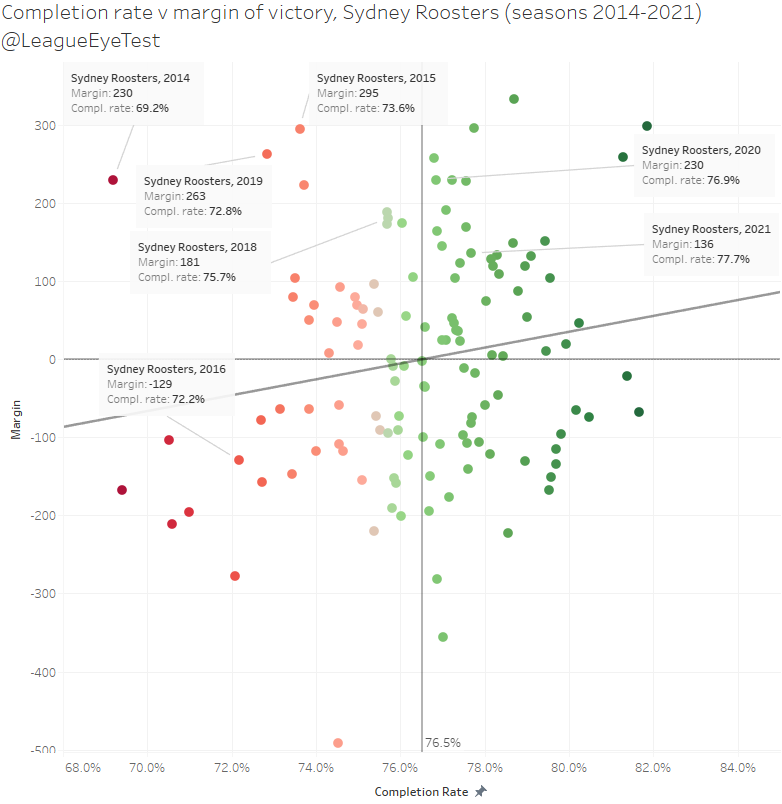
Now of course since you’re all avid Eye Test readers you’ll know my stance on using completion rates as a measuring stick in a vacuum is a waste of time. But we’re giving it some context here with a team that has historically won titles with a low completion rate as you can see below (as of 2021 season).
The Roosters have another day game this Saturday, 3pm against the Warriors at home, and another seven games starting at 4pm or earlier for the rest of the 2023 season. Will the trend continue?
Obligatory Dolphins bit
The team that beat the Roosters defied all expectations with their inaugural win on Sunday. You couldn’t have asked for a better first up game for The Dolphins, who were derided for a number of reasons such as their forward pack was too old and they had no star players.
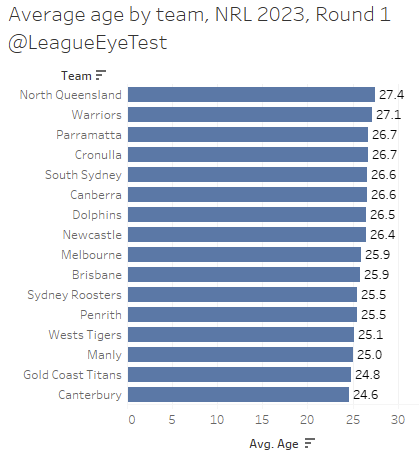
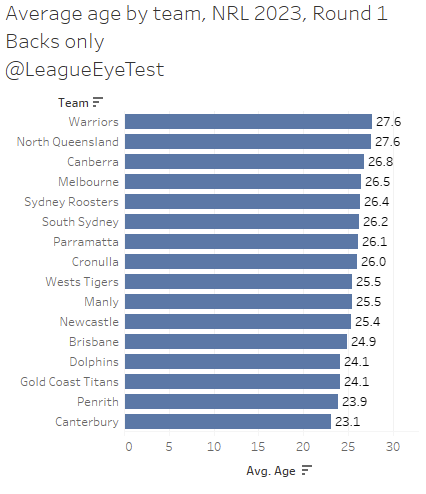
Are The Dolphins really that old? For the average age of their 17, they’re only the 5th oldest at 26.5 years.
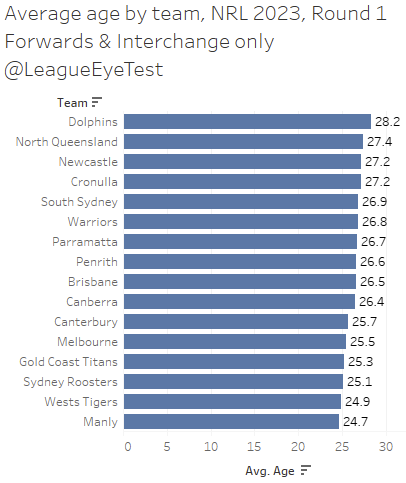
Where they are the oldest is no surprise and that’s in the forwards, averaging over 28 years old.
Unsurprisingly given the above, they had the 4th youngest back line at just 24.1 years of age, only besting the Panthers, Titans and Bulldogs.
Those old heads in the forward pack certainly helped against the Roosters. Remember all that “there’s not enough talent for expansion?” talk? Evidently that’s not the case and was something I’ve mentioned repeatedly before.
As I noted over a year ago on this very site:
“Circling back to the start of this post, it’s not the lack of first grade players that is the concern with expansion. There’s not a shortage of quality players. If anything, there’s a lot of fringe first grade and squad players sitting in the tier below the NRL as Melbourne consistently has shown.
What there is a shortage of is quality NRL coaches who are able to develop players. There’s only 17 spots available and openings seem to go to those who failed the loudest previously. Chasing short term results over the process of development plays a huge factor in this”.
And it still rings true, The Dolphins have put together a roster comprising mostly of castaways and veterans, yet Wayne Bennett made the Roosters look like the expansion team on Sunday with the way they were run off the field. Maybe they won’t win many more games this season, but they’ve shown they’re not likely to be the pushovers everyone expected. It’s rare that a Wayne Bennett team doesn’t compete.
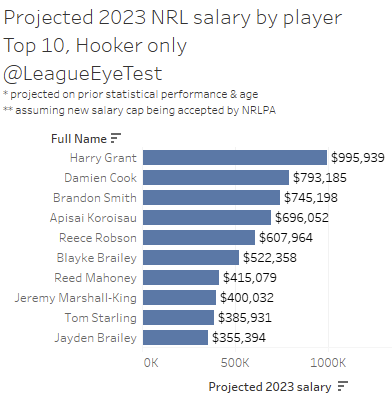
Part of that is due to some underrated signings, like picking up Jeremy Marshall-King from the Bulldogs.
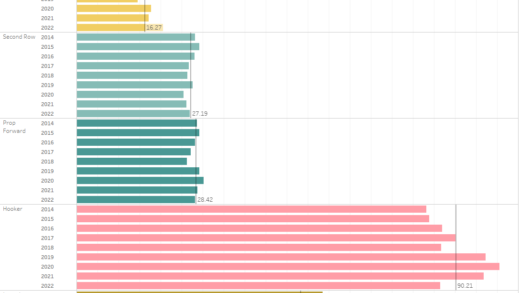
I’d projected Marshall-King as the 8th best hooker in the NRL (based on prior statistics and expected progression due to age – you can read about it here), but that might have been too low considering how impactful he was for the Dolphins yesterday. Below are the salaries for the top 12 hookers I’d projected this season.
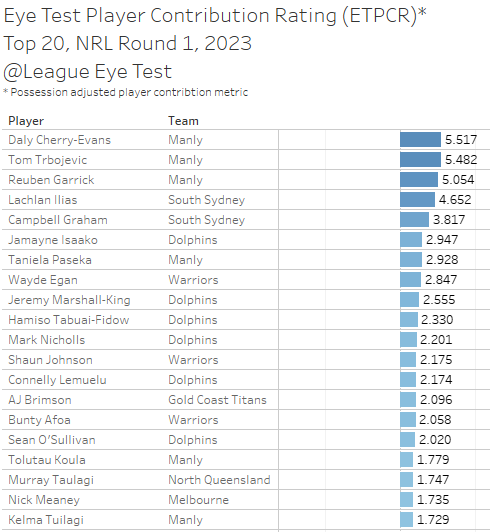
Fast forward to Round 1, and Marshall-King ended up 8th for the round by my Eye Test Player Contribution Rate (ETPCR) at +2.555 points added per 270 possessions (normalised number of possessions per game), and only behind Jamayne Isaako (another cast off from the Broncos) of all Dolphins players.
Sean O’Sullivan was another, who ended up ranked 5th among halfbacks in my 2023 projections, see below.
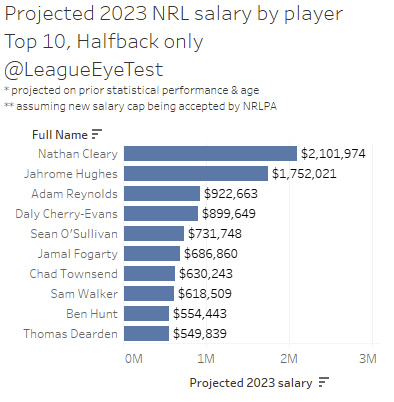
It does seem high, but as noted in the post on this methodology if you look at O’Sullivan as the replacement player for Nathan Cleary on the best team in the competition, providing about 1/3 of the value seems about right. It’s a great case study on what level of output you could expect from a “replacement level” player on a good team.
Maybe O’Sullivan isn’t as replacement level as we’d believe? He didn’t rank that far behind Marshall-King with an ETPCR of +2.020 and was probably the most impactful half on the field. Tom Gilbert was another great signing for the club, one I noted very early last season with his improved play, and whilst he didn’t feature in the top players by ETPCR this round (middles rarely do), his improvement should continue under Bennett and alongside some veteran forwards from the Storm’s heyday.
Again, it’s small sample sizes but that’s all we have to work off in one game and wait for a more representative sample size to make better judgements. But even taking that into account, there’s a lot to like about The Dolphins thus far. Despite the constant talk in the media, you don’t necessarily need a team of star players.
If you enjoyed this post please consider supporting The Rugby League Eye Test through a donation via one of the links below.