The NRL season has hit the slow period of the season to accomodate for State of Origin, meaning it’s a good time to continue the Eye Test’s review of the first half of the season. Last week we looked at the decline of 80-minute players. This week we’re diving into the advanced statistic leaders for the season up to Round 12.
If you’re unfamiliar with the advanced stats used here at the Eye Test, I’d recommend checking out the glossary page on the site to get up to speed. If you want a longer run down, there are longer posts on Tackle %, Run % and Involvement Rate that talk about how they are calculated and how they should be used.
If you want an even quicker rundown than the Glossary page, here’s the cliff notes. Tackle % and Run % show the % of completed tackles or run made by a player whilst on field, adjusted for minutes played and possession. Involvement Rate combines both Tackle % and Run %, and all three are “work rate” metrics to gauge the contributions of players (typically middle forwards) who don’t play big minutes.
The average rate for each of these metrics can be seen in the chart below. Generally middle forwards (front row, hooker, lock and most interchagne players) make tackles at a rate in the 25% range, have a run rate in the 10-12% range and their Involvement Rate sits between 14-19%. As you move further out to the edges and outside back positions those numbers continue to drop as they are doing less of the grunt work.
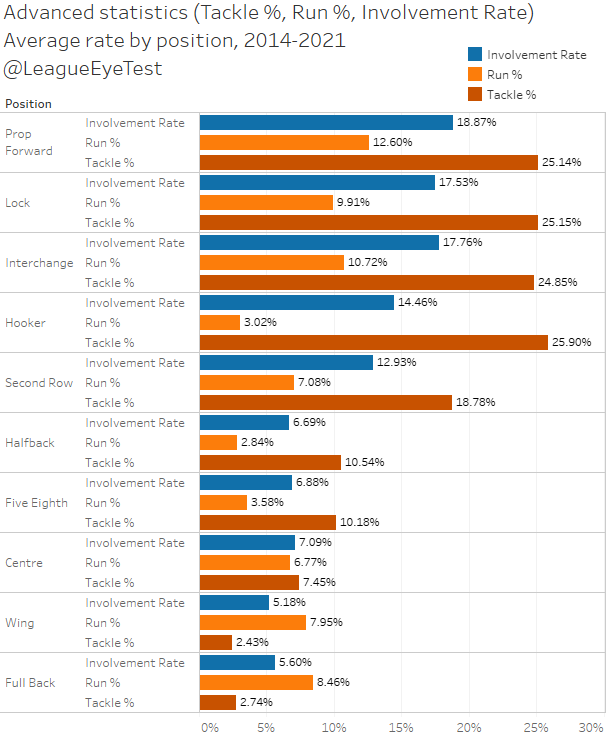
One thing worth mentioning is that the Melbourne Storm use a similar metric for “work rate markers”, calculating runs, tackles, supports and kick pressure on a per minute basis. Great minds etc…
Net Points Responsible For (NPRF) is a metric to show the contributions of players beyond the typical try and try assist statistics. And finally, Error Rate is a measurement to identify players who are committing errors more frequently.
For the first three advanced stats, I’ve implemented a minimum of three games played and 120 minutes (playing at least three full halves) to filter out any players with a low sample size. For Net Points Responsible For, I’ve increased the threshold to give games played, as one or two blowouts can skew the data. For Error Rate, the limits are four errors committed and three games played, again to remove any small sample biases.
These statistics are for the first half of the season (Rounds 1-12), and don’t include the recently completed Round 13. And as usual I’m using Fox Sports NRL statistics.
Now the formalities are out of the way, let’s move on to look at the season leaders for the first half of
Tackle % leaders
North Queensland forward Reuben Cotter leads the way with a tackle % of 34.85% in his four games this season. Unfortunately, as he is out for a lengthy period due to Lisfranc surgery and probably won’t make the end of year minute qualification, which is usually between 150-250 minutes played, and is something I gradually increase as the season progresses.
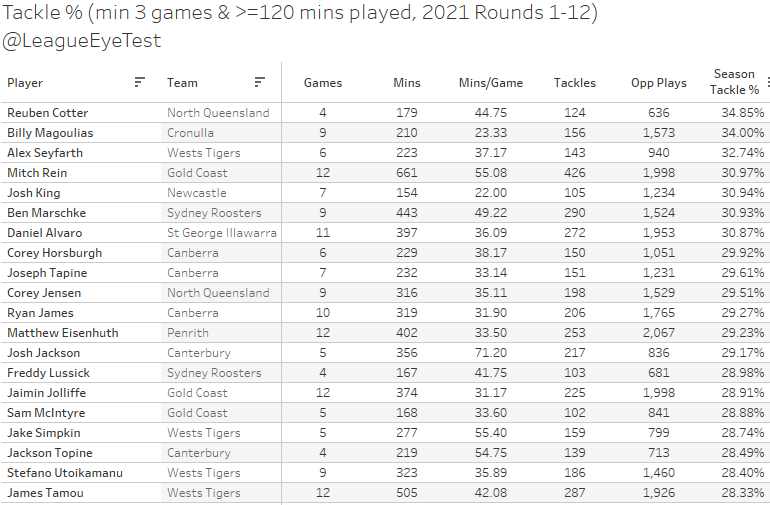
Still his tackle % is almost 10% higher than the average middle forward, with props (25.1%), locks (25.1%), interchange (24.9%) and hookers (25.9%) all sitting in the 25% range, or completing a tackle on one in four possessions.
Coming in behind Cotter is the Sharks interchange forward Billy Magoulias with a tackle rate of 34.0%, followed by promising Tigers middle Alex Seyfarth at 32.74%.
Eye Test first ballot Hall of Famer Daniel Alvaro comes in at 7th with a rate of 30.87%, his seventh season with a tackle rate over 30%, meaning he completes a tackle in three out of every ten opponent plays whilst on the field. Alvaro owns three of the top four end of season tackle rates and can usually be spotted in the top 10-20 players on a weekly basis.
An interesting thing to note is that there are only seven players with a tackle rate of 30% or above. Last season by Round 12 there were 21. In 2019 there were 26. Is this another data point suggesting fatigue is an issue?
Run % leaders
Penrith’s middle forward machine Spencer Leniu of Penrith takes first place with a run rate of 17.11%, indicating he is completing a run on nearly two out of every five plays for the Panthers. As noted above, the average front rower Run Rate is 12.6%, with Leniu nearly 50% above that number at over 17%.
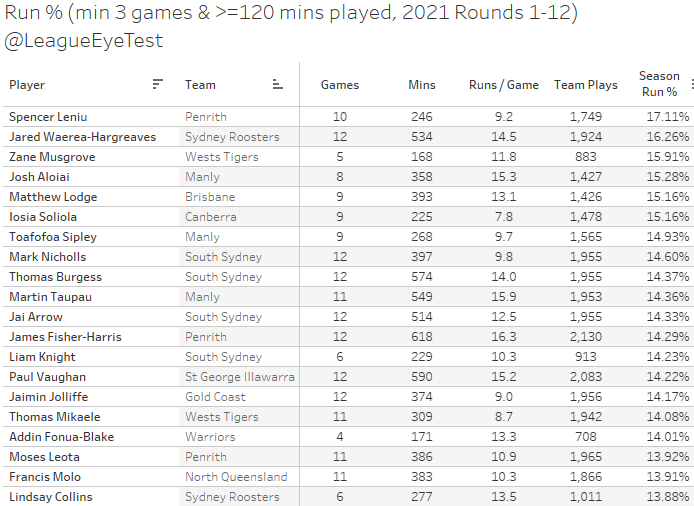
Leniu was on fire early in the season getting through a huge amount of work in his limited minutes, ranking 1st, 1st, 6th, 80th and 1st in his first five rounds of the season. He’s also the only player with a run rate above 17% this season.
Second place is taken by Roosters prop Jared Warea-Hargreaves at 16.26%, with the Tigers Zane Musgrove rounding out the top three at 15.91%, ahead of former Tiger Josh Aloiai at 15.28%
This year we have seven players with a run rate above 15%, and unlike Tackle % that number is in the same range as 2020 (eight players with 15% or more) and 2019 (five).
Involvement Rate leaders
Given that Involvement Rate is a combination of Tackle % and Run %, it’s no surprise that Reuben Cotter sits at the top of the Involvement Rate chart, with a rate of 22.75%. This means he is either completing a run or tackle on more than one in five plays whilst on the field. The average middle forward has an involvement rate in the 14-19% range, with Cotter sitting at least 3% higher than front rowers and 4% higher than locks.
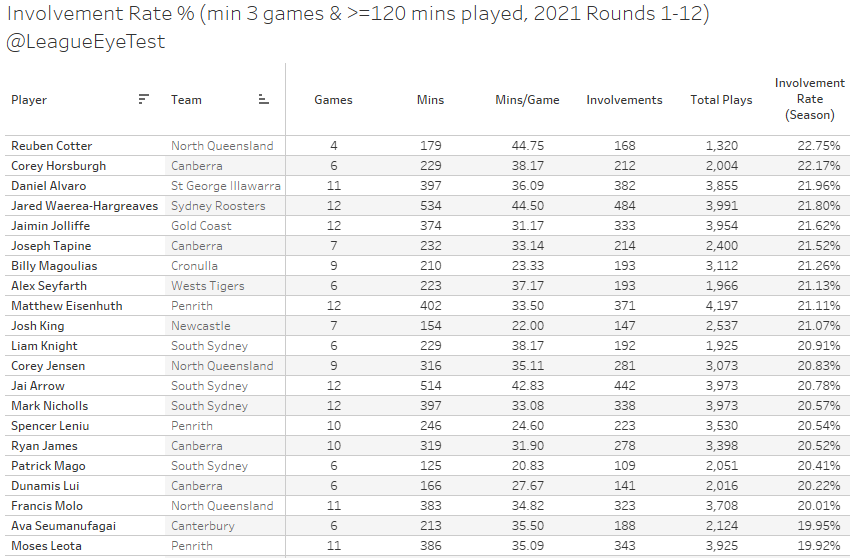
Second place goes to the Raiders Corey Horsburgh at 22.17%, with that man again Daniel Alvaro snaring third place at 21.96%.
This season there are 20 players with an Involvement Rate of 20% or higher, compared with 29 in 2020 and 48(!) in 2019. To me this is a clear indication that fatigue is having a huge impact on the game.
When looking at 80-minute numbers, the totals and averages may be the same or very similar, which could indicate there’s no change in the speed or pace of the game. However, if fewer players are completing a run or tackle at a high rate, that would indicate that they’re unable to keep up a high workload over the similar periods of time.
Remember that these advanced statistics are not only minute adjusted, but possession adjusted. This means that they are comparable regardless of any raw increase or decrease in minutes played or ball in play.
Net Points Responsible For leaders
Net Points Responsible For (NPRF) is a metric for a player’s overall contribution to a team’s scoring or defense. It is not a measure of overall performance, since it only uses points scored, contributed towards, or allowed. If you do want to put a number on a players overall production, Liam at PythgoNRL has a fantastic overall player performance metric.
Returning to NPRF, this the way it is calculated. Each score by a player is valued as it is on the scoreboard (try – 4, goal – 2, field goal – 1 or 2), plus 4 points for every try assist and try contribution. Four points are removed for every try cause a player concedes as a way of quantifying their defensive contribution. This total is then divided by the number of games played to get a plus or minus total points per game that a player is “responsible” for.
It is a great way of valuing a playmakers influence if they aren’t directly scoring tries or throwing passes that are deemed try assists. By adding in Try Contributions, something like the famed a “hockey assist” (the pass that least to the pass that sets up a score), you can more accurately judge the impact of a player whose involvement may not show up in regular statistics.
With that out of the way, here’s the top players for 2021 thus far.
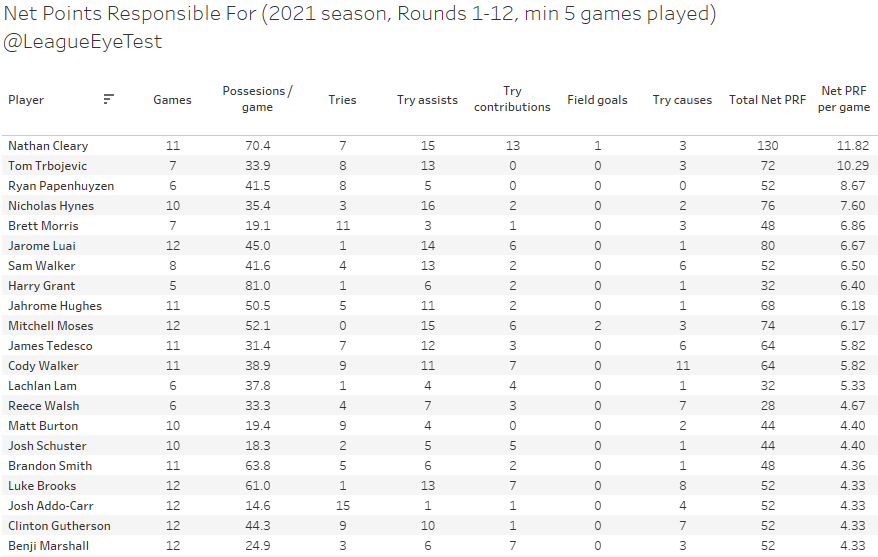
No one should be surprised with Nathan Cleary topping the list, and at 11.82 NPRF/game, he’s directly adding almost 12 net points per game to the Panthers this season. To put that in perspective, the Bulldogs are averaging just over 11 points scored per game as a team. Given Cleary is touching the ball over 70 times per game, more than any other half in the competition, it’s not surprising his impact on a game is so immense.
Tom Trbojevic is adding +10.29 NPRF/game for the Sea Eagles this season, and his mere presence on the field has turned them from wooden spoon contenders to a legitimate finals football team.
Third and fourth places are taken by a pair of Storm fullbacks, Ryan Papenhuyzen (+8.67) and Nicho Hynes (+7.60). The Storm have four players inside the top 10, with Harry Grant (+6.4) and Jahrome Hughes (+6.18) also having strong seasons.
It’s also worth noting just how good Brett Morris was playing this season at 34, with the fifth best NPRF average this season. The Eye Test would like to wish him the best in retirement, he will be missed.
This chart also indicates how important defense is. Cody Walker is having a great season with the ball, scoring nine tries, handing out 11 try assists and contributing seven more, playing him second in the NRL for total try involvements. But with 11 try causes for the season (meaning he was deemed responsible for conceding a try) his NPRF per game is only +5.89. Without those try causes his points responsible for would be +9.81 per game, well inside the top five.
Error Rate leaders
The last advanced statistic we’re looking at this week is Error Rate, which is the number of possessions it takes for a player to commit an error. As a rough guide, anything less than 10 is terrible, and between 10-15 is bad, and 15-30 is not good.
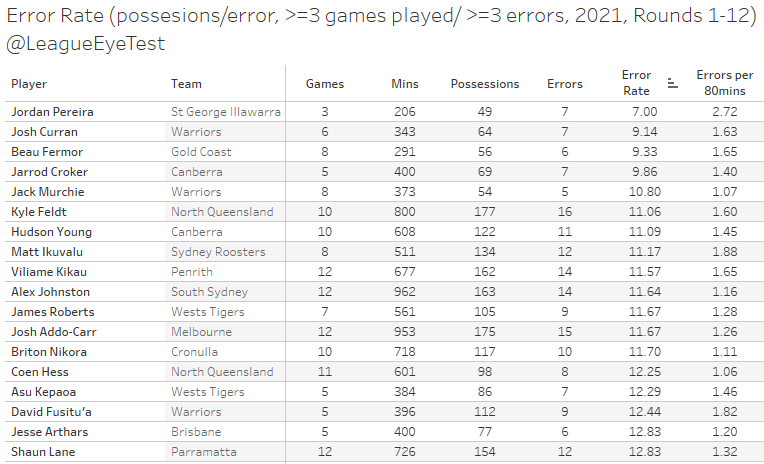
Dragons winger Jordan Pereira takes top (or should that be bottom?) spot with an error every seven possessions in his three games. That equates to nearly three errors per 80 minutes, which you don’t need me to tell you is not good.
Second place is Warriors backrower Josh Curran, who is committing an error every 9.14 possessions, with Titans edge Beau Fermor at 9.33 making up the top three. Canberra veteran Jarrod Croker is the only other player with an Error Rate under 10 at 9.86.
Pereira is unlucky that I haven’t set the minimum games played threshold for Error Rate at two games played, as Wests Tigers winger Zac Cinto has committed seven errors in just 34 possessions this season for a rate of one error every 4.86 possessions. But as he has only played the two games, he’s currently excluded from this list.
On the positive side of things, Jayden Brailey has the best error rate in the NRL, with just one error in 1,419 possessions. Given hookers are usually just moving the ball from dummy half 150 times a game, it’s understandable they’re not committing too many mistakes.
A special shout out goes to NRL Physio’s favourite and grilled chicken connoisseur Alex Twal, who has played 653 minutes this season, touched the ball 171 times and is yet to commit an error. He’s the only player with at least 500 minutes played yet to commit one.