I don’t think I’ve ever had an article requested as much as this post. After the Michael Potter/Trent Barrett comparison was posted a few weeks back, I lost track of the number of requests by Twitter and email to look into the Tigers performances under Brett Kimmorley as opposed to Michael Maguire.
And in true Eye Test fashion I’ve not let my readers down (I hope).
I’m not going to get into any substantial background on this one. Brett Kimmorley is in charge now and the Tigers scored what could their biggest win of the season against Brisbane on Saturday. We know the story with Maguire, the media inundated us with countless stories about Madge’s performance and relationship with the players. Is Luke Brooks going or staying? Just how many players have they let go who are playing first grade elsewhere?
With Kimmorley and the Tigers scoring what could their biggest win of the season against Brisbane on Saturday, it’s the perfect time to look into what they’re doing differently under their new coach. As we saw with the Michael Potter coach it’s amazing to see what improvement can be gained by adding a decent first grade coach over a theoretical one. Will we see the same at the Tigers from an untested first grade coach against someone who may have seen the game pass him by?
As suggested above, I wanted to wait until there was a larger sample size than five games to run the comparisons for. As it turned out Noddy went and contracted Covid so technically his sixth game was helmed by Ben Gardiner and Nathan Cayless. Still, I’ve included that game in this sample size of seven because I can. Like with the Potter analysis, it’s still smaller than I’d like but the results are still indicative than representative.
I’ve gone with the same approach as last time, but for those who missed the Bulldogs post I’ll lay it out again. We’re looking at the percentage change in possession adjusted statistics for the Wests Tigers in the 12 games under Michael Maguire this season compared to the seven games that Kimmorley has overseen.
We’re using percentage change rather than absolute increase in points scored from 15 to 16 per game doesn’t easily fit on a chart with the increase in run metres from 1311 to 1356 per game. Using percentage change gives a better perspective of how big the increase is rather than the raw numbers.
And why possession adjusted? It’s to remove any bias from an increase or decrease of possession under either coach. Attack wise it’s pretty similar – an average of 143 play the balls under Noddy and 140 per game under Madge. Defensively it’s a bit different – 147 under Noddy and 139 under Madge, over a full set difference.
To combat this, we’ve normalised it to 135 play the balls in attack and defense to give a like for like comparison. If you want to know why I’ve chosen 135, that is clarified in my Eye Test Player Contribution Rating (ETPCR) explainer on the site.
Let’s get started then. Below is the percentage change of several key statistics for the Wests Tigers this season under Kimmorley compared to Maguire (orange dots) against the games under Maguire compared to Kimmorley (blue dots), with the grey line indicating the difference between those points. Whichever dot sits further to the right indicates better performance.
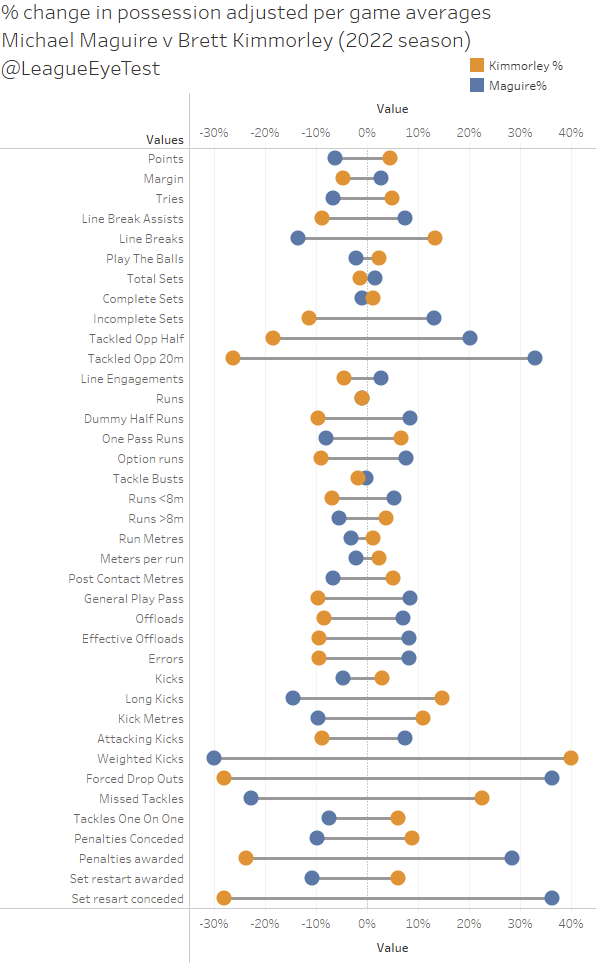
Looking at the results, it’s a bit of a mixed bag when comparing the performance under each coach and nowhere near as clear as it was when the Bulldogs moved from Barrett to Potter.
Under Kimmorley the Tigers have had +2.3% more play the balls (as referenced above) but -1.5% more sets with the football. This can be attributed to Kimmorley’s teams taking better care of the football, where errors are down 9.5% compared to his predecessor. This naturally leads to incomplete sets down 9.5 and completed sets up 1.1%.
I’ve mentioned previously that completion rates are somewhat of a junk statistic, as Dean Pay and Barrett showed with the Dogs, but Kimmorley has the team respecting possession of the football which isn’t a bad thing. Part of that can be seen with is fewer offloads, as they have declined by 8.4%. This extra possession has led to more points, a possession adjusted increase of +4.4% under Kimmorley. Even if you remove the possession normalisation, the increase is 6.6% which is a healthy over index on 2.3% more possession, showing it’s not just more ball that is leading to more points.
Their average possession adjusted margin has dropped to, from -9.48 under Maguire to -9.04 under Kimmorley.
Looking at the margin breakdown by minute (keep in mind this isn’t possession adjusted), the Tigers ended up down 9.83 points on average after 80 minutes under Maguire.
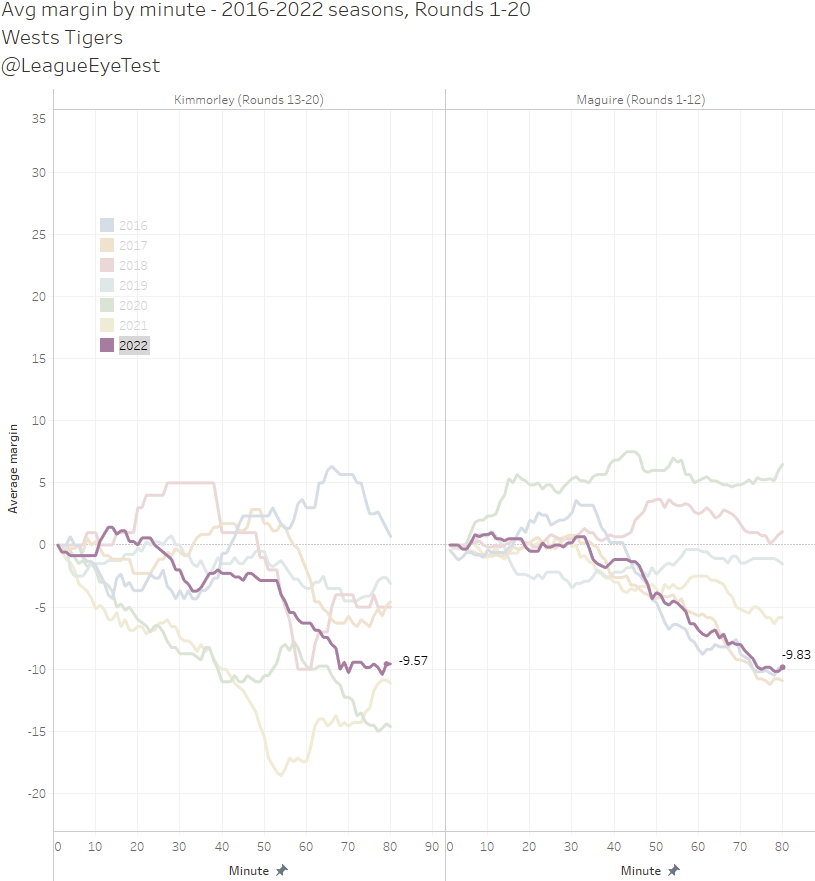
They generally had a tiny lead in the first half, ahead by up to 0.67 points on average by the 33rd minute. Then the wheels fell off and that number dropped to -1.17 at half time and cratered after the 45th minute, going from -1.33 to -9.83 after the long whistle.
Under Kimmorley they’ve had some small average leads and deficits in the first half, but the drop in second half margin doesn’t occur until the 53rd minute as opposed to the 45th minute, and tapers off in the 9.5 range for the final 10 minutes of games. Like the Bulldogs, they’re more competitive for longer, although the difference isn’t as stark as it was for Canterbury.
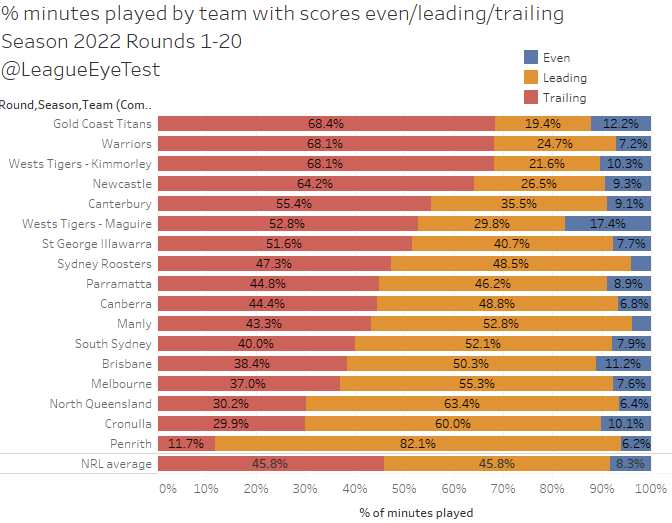
That said, they’re still playing more minutes trailing than under Maguire – 68.1% to 52.8%.
But as we can see above in the minute by minute chart they’re more competitive staying within one score for longer in games. And they should have two wins instead of one to show for it, but let’s not get into that again.
Correspondingly with 4.4% more points being scored by the Tigers with their new coach, you’re seeing 7% more tries and 13% more line breaks. Interestingly the number of line break assists are down 9% under Kimmorley, which would indicate more self-created breaks rather than players needing to be put into a gap under Maguire.
What isn’t over indexing is what they’re doing with the extra possessions. Runs are down 1.1%, line engagements down 4.5%. Some of this a change in mix. Kimmorley’s side is seeing fewer dashes from dummy half (down 7.7%) whilst standard hitups (one pass runs) are up 6.6%. This correlates with the drop in general play passes of 9.7%
Whilst the number of runs is down, the Tigers are covering more ground. Total run metres are up 1.1% under the new coach, with 5% more post contact metres. Breaking that down, Kimmorley’s sides are seeing -7% fewer runs under 8 metres, but 3.6% more longer than 8 metres. Longer runs equates to a higher metres per run number as well, jumping from 8.41 to 8.60. The post contact metre number could be higher though, as there’s been a drop of 1.9% in tackle busts in the last seven games. Overall option runs (supports and decoys) are down 9% under Kimmorley as well.
Field position has been a major change under Kimmorley. The Tigers are seeing 18.5% fewer play the balls inside an opponent’s half and 27% fewer inside 20 metres.
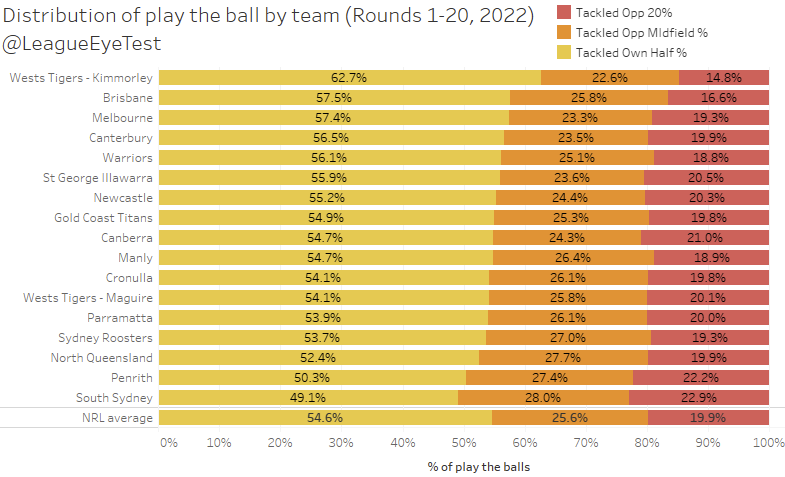
The 62.7% of play the balls inside their own half is by far the highest in the league. Yet as we mentioned above points scored for the Tigers since Round 13 are up. Like the Bulldogs, the Tigers are doing more with less under Kimmorley.
There’s been a big change in kicking outcomes as well. Overall, the Tigers are kicking the ball more (+2.8%) and longer (+8.4% kick metres gained), coming from 14% more long kicks. What they have done with their attacking kicks is change the target of them, with 28% fewer forced dropouts and only one kick dead from Kimmorley’s teams compared to eight under Maguire. Like most NRL teams now, they’re aiming their attacking kicks shallower to reduce the chance of a seven tackle set.
On the defensive side of the ball there’s improvements and regressions. One such deterioration is seen in the chart above shows a 22% increase in missed tackles by Kimmorley coached sides. Here is the breakdown of statistics conceded against them.

Teams facing Kimmorley have seen a jump of +6% in play the balls. What is pleasing about that number is that there has been a possession adjusted -2.6% drop in points scored against them, showing that they can defend in longer stretches without giving away more points.
Things get interesting when you look and see that their tries conceded are down 14.5% under Noddy. That didn’t make any sense until I saw the goals kicked against the Tigers during his seven games were up 28.9%. Complicating this even further was that goal attempts under Kimmorley are down 12.3%. Teams were scoring fewer tries and kicking more goals?
This led me to checking the % makes by opposing teams against the Tigers this season and found something ridiculous.
Against Maguire, opposing teams kicked 39/61 goal attempts, at a 64% rate. Under Kimmorley, opposing teams have kicked 31/33 goals for an incredible 94% rate. The only players to miss a goal kick against the Tigers since Kimmorley took over was Reuben Garrick in the 61st minute of Round 14 and Mitch Moses in the 37th minute of Round 17.
The average kicker is making 75% of their goal attempts this season. That 64% against Maguire was the lowest of all NRL coaches this season, the next lowest was Craig Bellamy who sees kickers make 65% against the Storm.
The 94% against Kimmorley’s sides was unsurprisingly the highest of all coaches this season. Next highest was nearly 10% lower, with the Raiders seeing opposing kickers make almost 84% of attempts. Teams have nearly kicked more goals against seven games of Kimmorley coached Tigers sides (31) than they did in 12 games under Madge (39).
That means the Tigers are conceding an extra 2 points more than expected on goal kicks alone, while Maguire was benefiting from teams kicking 1.1 points fewer than expected. With the number of close games, the Tigers have played, this difference is substantial.
Why are they kicking better against Kimmorley than Maguire? I haven’t seen as many Tigers games as I’d have hoped during this time, but my initial instinct would be that under Kimmorley the Tigers are conceding more tries in kickable positions than they were under his predecessor. Edge defense was a huge issue under Maguire so that would make sense. It may not be correct, please shoot me an email or DM if I’m wrong.
The rest of their statistics conceded don’t flatter Kimmorley but it depends on whether you are results or process orientated as to which ones to be concerned about.
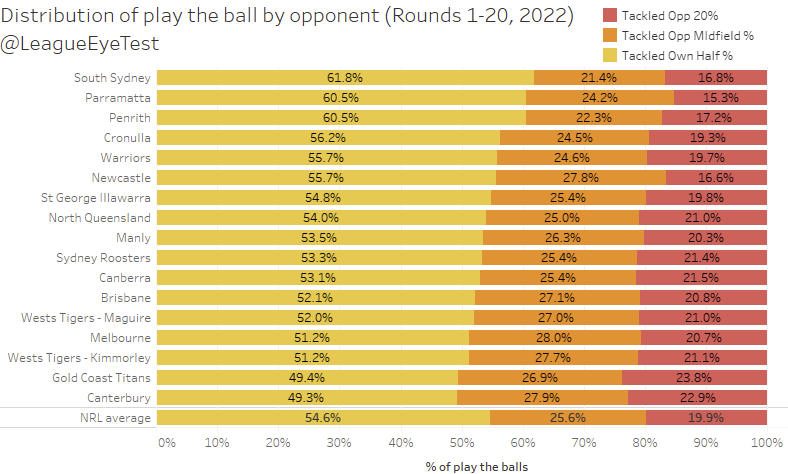
Opponents against Kimmorley are gaining 11% more run metres, +5% in post contact metres and spending more time in the Tigers half and 20 metre zone. They’re breaking 21% more tackles, gaining 11% more line breaks and offloading the ball 23% more.
The latter number must be of concern for the Tigers and wrapping up the ball carrier more effectively should be a priority as they’ve only won one post contact metre battle since Round 13 as seen below.
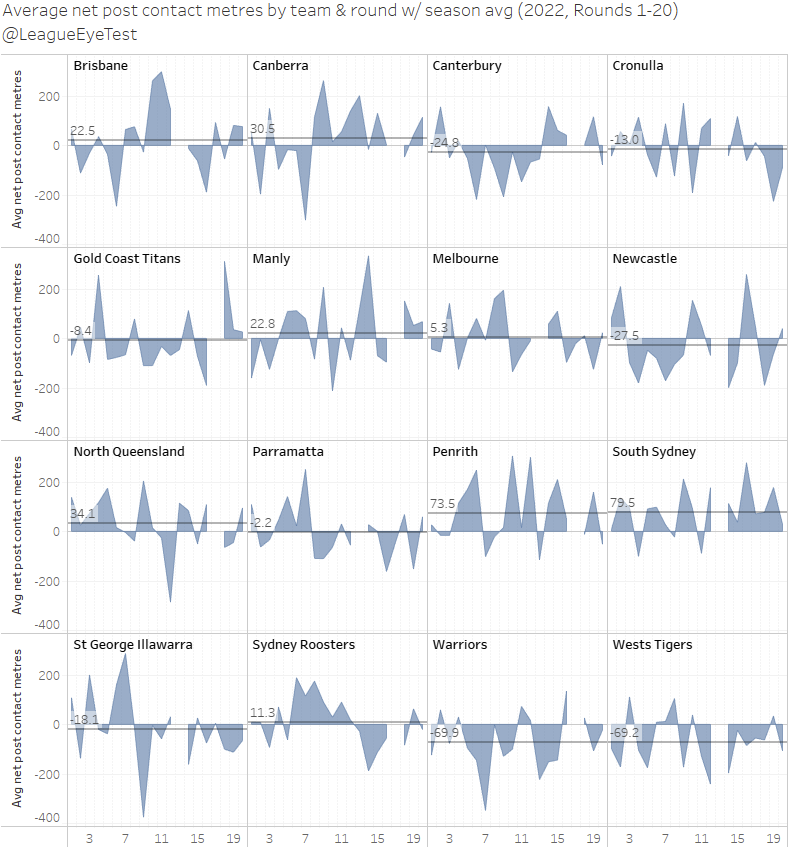
They’re giving up 69.2 more post contact metres than they gain this season. Their inability to win battles in the middle of the field isn’t new, and is something I’ve posted about previously. This would point to it being an issue of having too many of the same type of player, and not enough players who can bend a defensive line and push through contact.
And defensively, they’re seeing a similar share of play the balls inside their half. That number was 52.0% under Maguire and is 51.2% under Kimmorley.
Bringing all of this together, as stated above it’s a bit of a mixed bag for the Tigers under Brett Kimmorley, leaning slightly towards an improved side than we saw under Michael Maguire.
Like the Dogs they’re scoring more points with worse field position, not requiring a mountain of goal line possession to produce points. Kimmorley has the Tigers spreading the ball less and playing a more simple brand of football, resulting in fewer errors and better possession.
Defensively it’s even more up and down. On the plus side, they’re giving away 6% more play the balls, so whilst Kimmorley’s team is giving up more points per game than Maguire’s, when adjusted for possession its actually down 2.6%. And that number should be even lower, as teams are kicking an unrealistic 94% of goal attempts.
Under Kimmorley the Tigers are conceding more line breaks and tackle breaks, which would indicate that they’re defending their line slightly better if teams are moving up and down the field easier but scoring fewer points. And whilst they are conceding fewer points, they’ve been spending more time behind on the scoreboard than under Maguire although generally at a smaller margin. For a rookie coach with no first grade track record to end up with similar results than his premiership winning predecessor probably says something about how much the current playing group had tuned out Maguire.
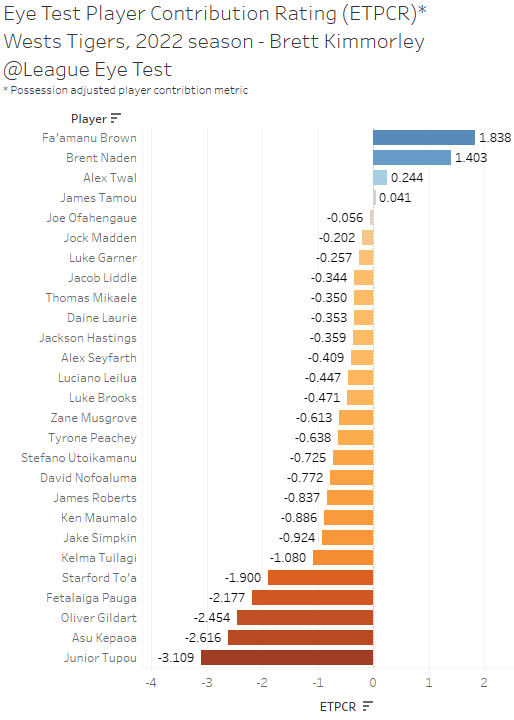
Lastly, we’re going to look at the change in ETPCR scores for Tigers players under Maguire and Kimmorley. First up let’s look at them under Madge.
Under Maguire, almost everyone was a net negative player outside of two games each from Fa’amanu Brown and Brent Naden. Alex Twal and James Tamou squeaked over the average mark at +0.244 and +0.041 respectively. Their outside backs were a dumpster fire, with four players responsible for -2 points per game or more.
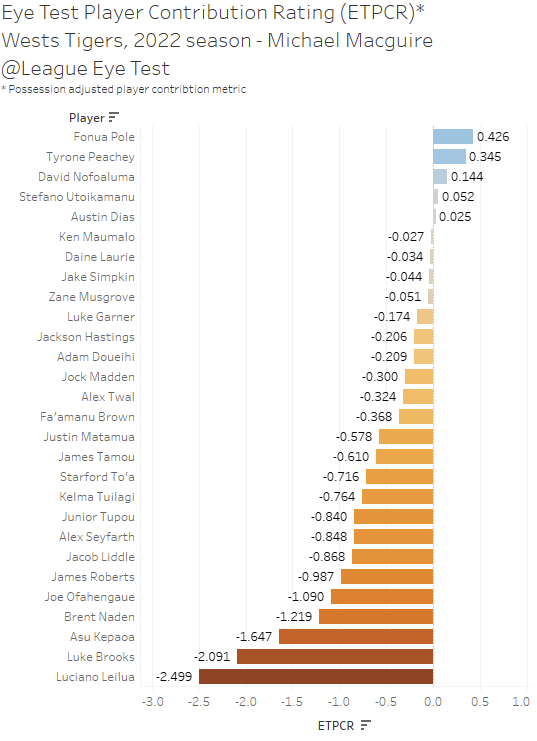
Under Kimmorley some of these numbers have changed, but not the huge positive swings we saw for the Bulldogs under Potter.
Some of them are 1 or 2 game samples like Tyrone Peachey or Luciano Leilua and can probably be overlooked. One of the largest positive gains is Ken Maumalo, who went from a -0.886 ETPCR average to almost neutral at -0.027. Zane Musgrove as well improved, going from -0.613 to -0.051.
One of the bigger negative changes has been Joe Ofahengaue, who moved from -0.056 under Maguire to -1.090 under Kimmorley. Luke Brooks is another who had a significant change, going from -0.471 to -2.091 and probably out of the club for next season.
If you enjoyed this post please consider supporting The Rugby League Eye Test through one of the links below.
Scan the QR code or copy the address below into your wallet to send some Bitcoin to support the site Scan the QR code or copy the address below into your wallet to send some Ethereum to support the site Scan the QR code or copy the address below into your wallet to send some Litecoin to support the site Scan the QR code or copy the address below into your wallet to send some Bitcoin cash to support the site Select a wallet to accept donation in ETH BNB BUSD etc.. Donate To Address
 Donate Via Wallets Bitcoin
 Ethereum
 Litecoin
 Bitcoin cash
Support The Rugby League Eye Test
Support The Rugby League Eye Test
Support The Rugby League Eye Test
Support The Rugby League Eye Test
Donate Via Wallets