Just when you thought things had bottomed out for the Dragons, they seem to find a way to dig even deeper. And I’m not just talking about the drama surrounding Ben Hunt.
How dire have the Dragons been this season? They’re below the Bulldogs, and I’d give the Dogs an incomplete grade given their injury issues and how young their average squad is. The Dragons don’t get the benefit of either excuse. They’re last on the ladder and have almost conceded the most points per game this season.
Their match on Friday against the Warriors was another example of their struggles this season. Below is the expected point chart for the match.
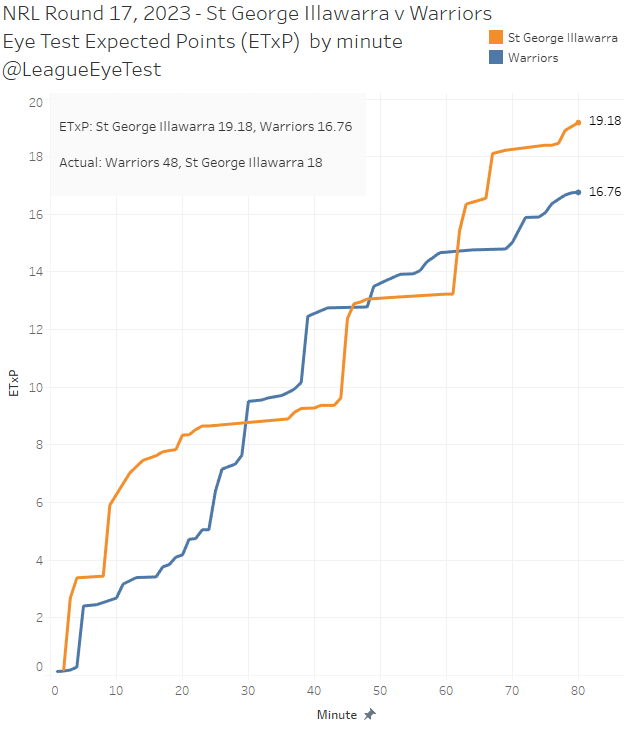
The Dragons didn’t give the Warriors much high value field position, but still managed to concede 48 points against an expected 16.76. On the positive side, the Dragons did basically match their expected total, which is fine if you’re not conceding dozens of points from areas where you shouldn’t be conceding.
2024 should be brighter for the club as incoming coach Shane Flanagan should help defensively. The Sharks under Flanagan from 2016-2018 were a protecting their own try line. Below is the average points conceded plotted against expected points by coach from 2016-2021.
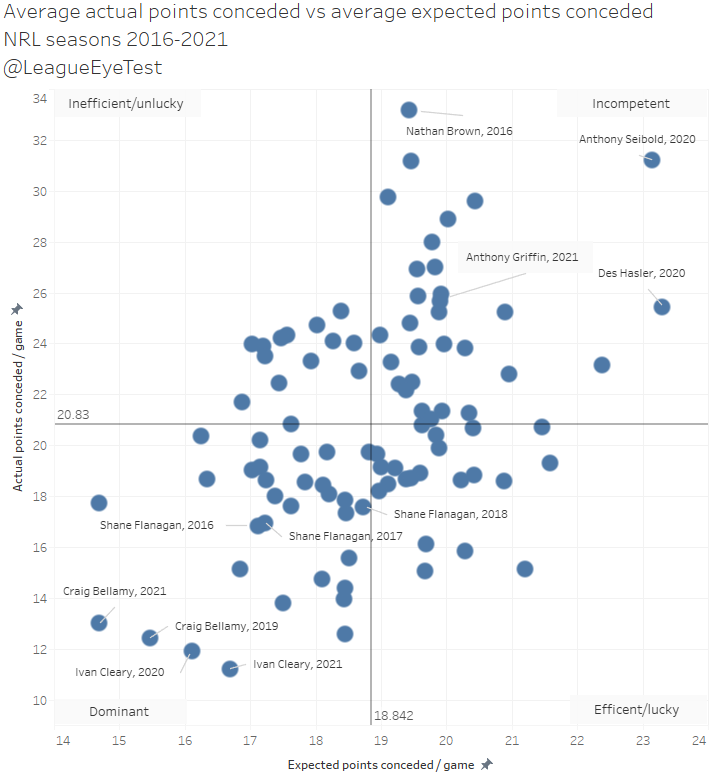
If you saw the horrific attempts at stopping the Warriors on Friday night when they couldn’t defend a closed door, it’s certainly a main area of the game the club needs to strengthen and Flanagan should help immediately.
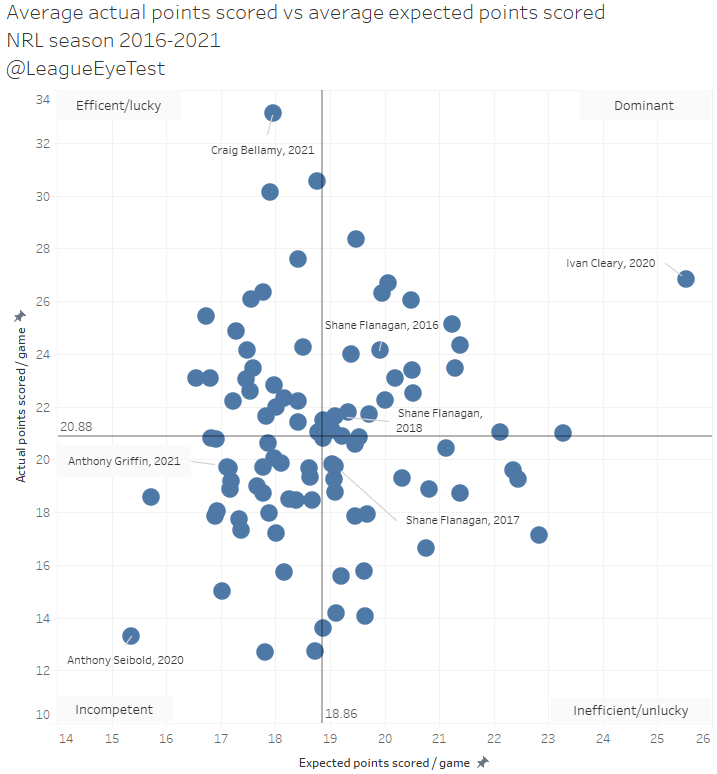
With the ball, his teams had a dominant season in 2016 but the other two were much closer to league average. Which given the current state of the Dragons would be an immense upgrade.
But Flanagan won’t have the same type of list he had at the Sharks to work his magic with. Although given his time in 2022 working as a list management consultant for the Dragons, you could wonder how many fingerprints he has on the current Saints roster.
So, what will Flanagan need to fix next season? One issue is getting behind on the scoreboard early.
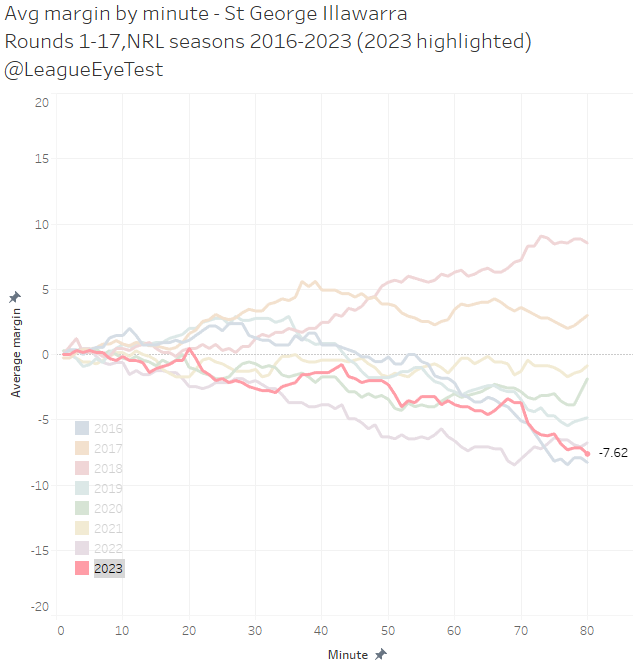
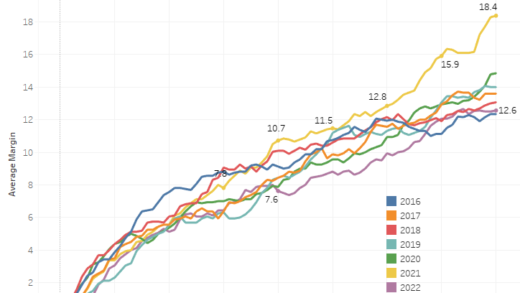
The Dragons haven’t had a positive average margin after 80 minutes since 2018. Since 2020, the latest they’ve had a positive average margin is the 20th minute this season, when they lead by the princely total of +0.46 points, after which it all goes downhill. Yes, in the last four seasons, the Red V haven’t had an average positive margin past the first quarter of a game. Even the Wests Tigers were able to do that, not that it was much better (around the 30th minute).
Why are they falling behind early?
Part of their issue is that their yardage by committee approach isn’t working. Below is the average metres per run by all NRL clubs this season after 17 rounds.
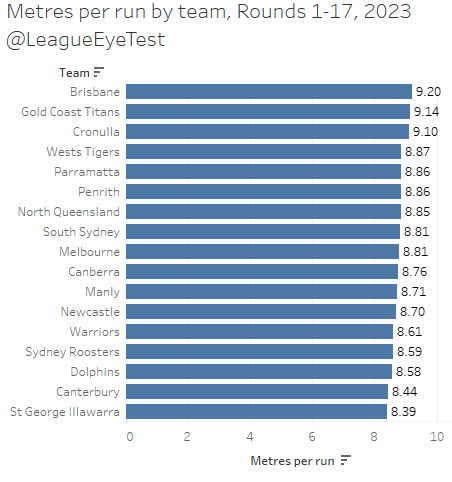
The Dragons sit dead last for metres per run at 8.39 per carry. There are three teams in the league averaging more than 9 metres per run – Brisbane, Gold Coast and Cronulla. The Broncos themselves average almost 80 centimetres more per run than the Dragons. It might not sound like much, but over the course of a game and 100+ runs these gaps add up.
And it’s an issue that they’ve had since 2021 as can be seen below, when they suddenly dropped from 8.97 metres per run to 8.43.
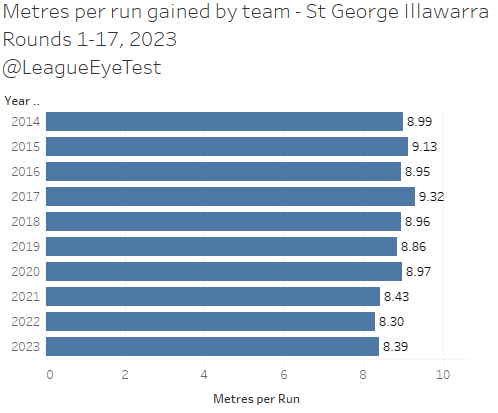
What happened in 2021 that would have caused such a change?

Oh, yes – that.
Keep in mind that the 2021 season was one of unparalleled statistical inflation, and the average metres per run increased by 1%. Only two teams had lost more than 10 centimetres per run from 2020 to 2021, the other was Parramatta who we’ve documented get around that by trying to string together as much possession as possible.
Meanwhile the St George Illawarra had three complete sets fewer in 2021 compared to 2020, meaning going backwards by half a metre is hideous in comparison. You’d almost have to be trying to be that ineffectual with the ball to go so far in reverse, or be a complete coaching dinosaur. Or both. But that’s the past, lets get back to 2023.
A key to this issue is the composition of their forward pack. The club doesn’t possess any forwards who bend the defensive line. Ben Murdoch-Masila is the only Dragons forward above the 58th percentile for metres per run, at 67%.
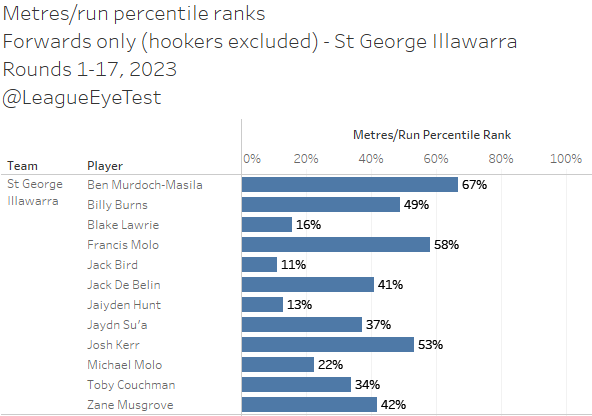
Which means one third of all forwards (excluding hookers) average more metres than ANY St George Illawarra forward, and 42% of them have longer runs than every Dragon except Murdoch-Masila. Most clubs will have at least one player approaching or above 80th percentile, and St George Illawarra has zero. Francis Molo is the only other Saints near the 60th percentile.
And the only other the club had in the top half of players besides Murdoch-Masila or Molo in metres per run was just allowed to move to the Dragons (Josh Kerr).
If you look at these numbers by average run metres, things look better but it emphasises the concerns.
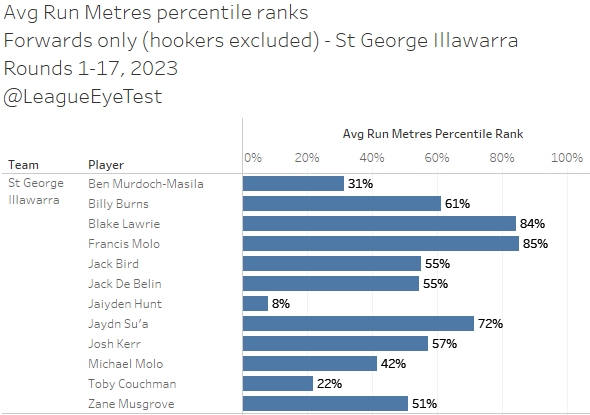
Blake Lawrie and Francis Molo rank in the 80s for average run metres per game, but as we saw above, they’re both low on the scale for metres per run, especially Lawrie who sits in the 15th percentile.
Which means to get those metres they’re going to need more runs, which requires more possession. It’s a reason why it causes St George Illawarra so many problems. They have more ball than their opponents in the first half, with 15.7 complete sets compared to 14.9.

They don’t take advantage of more sets in the first half due to their low metres per run. And in second halves they only see 13.8 complete sets, third lowest in the league. If you can’t get the ball downfield or break the line, how are you going to claw back the leads they’re giving up?
Along with discipline and line speed issues, they’re also terrible at wrapping up the ball early. St George Illawarra allow the most offloads per set of any team in the competition at .29 per set.
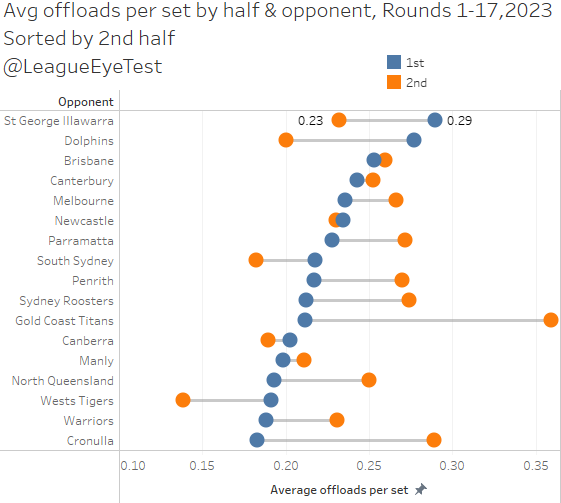
Their second half number for offloads allowed is much better at 0.22 which puts them mid table, but the damage is done.
The other interesting increase in their play over the past few seasons is that their general play passes (not counting those from dummy half) has increased from 98 in 2021 to 111 in 2022 and 105 in 2023. They’re passing the ball more but it’s not resulting in more points.
From a defensive point of view the Dragons are very mid table for metres per run conceded.

Their mark of yielding 8.83 metres per carry puts them ninth out of the NRL’s 17teams, you can’t get more mid than that. They’re not letting teams walk downfield with the ball, but at the end of sets their edge lets them down.
Their heat map of opponent play the balls shows this as well.
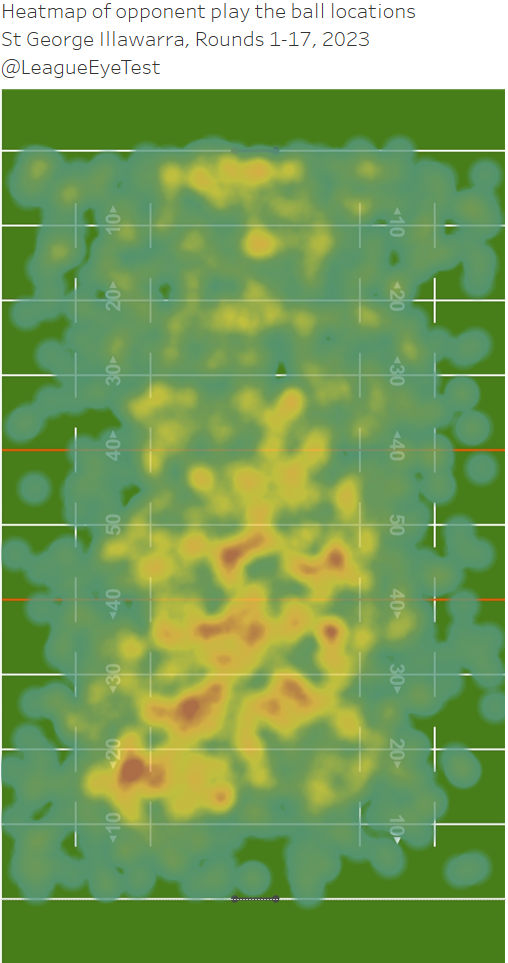
Again we can see that the Dragons don’t really concede a lot of possession close to the line. Even the usual high intensity area in front of the posts is relatively yellow as opposed to the deeper reds you’d see from other teams.
Friday evening’s game highlighted just how bad their edge defense is. Below is the bottom 20 players from Round 17 by the site’s Eye Test Player Contribution Rating (ETPCR) metric which values a players contribution based on statistics that correlate highly or poorly with winning. There’s an explainer on the site if you want to read more.
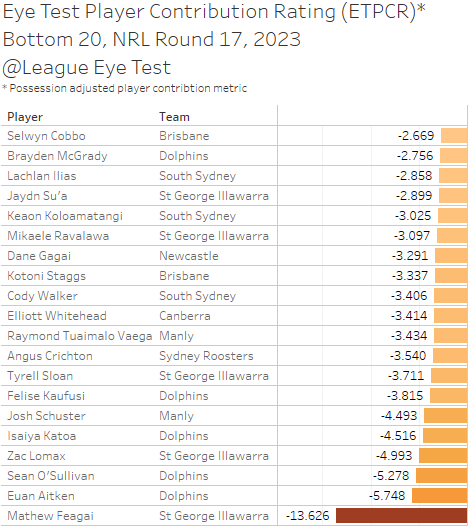
This game was a great example of the issues they have on the edges. What isn’t surprising is to see so many Dragons on this list given that they conceded 48 to the Wahs. Moses Suli was just outside this list with the 22nd worst number at -2.410.
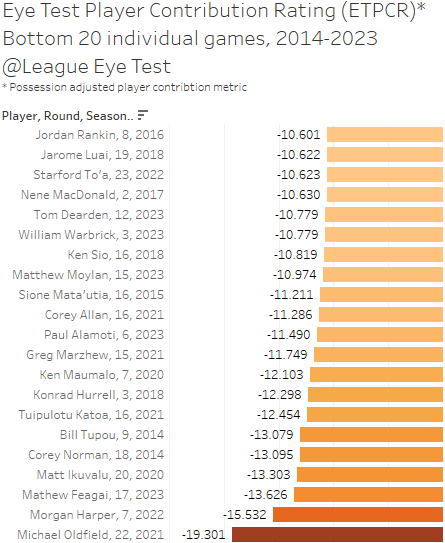
The damning number is that of Mathew Fegai, with an ETPCR number for the game -13.626. This indicates he was responsible for more than 13 points conceded on Friday, adjusted for possession and time on field. That number is the 3rd lowest single ETPCR score since I started tracking in 2014.
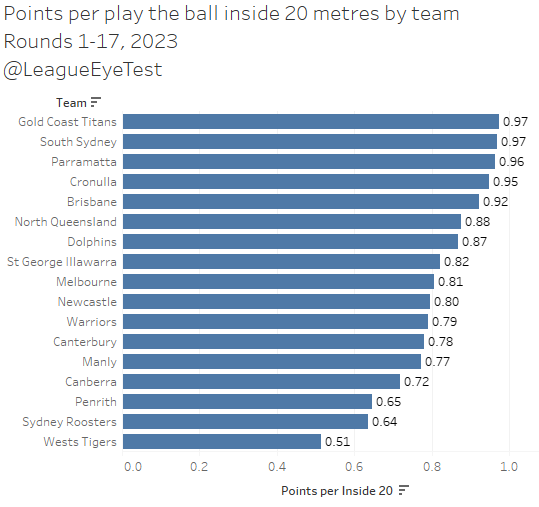
On a somewhat positive note, St George Illawarra’s attack isn’t that bad if they can get inside 20. If we look at their total points scored per tackle inside 20m, the Dragons have the seventh most efficient attack at 0.83 points. That’s better than Manly, Melbourne and Penrith.
And when they do get inside 20 metres, you can see from their heat map that they generally set up around the right hand upright to clear space to attack left.
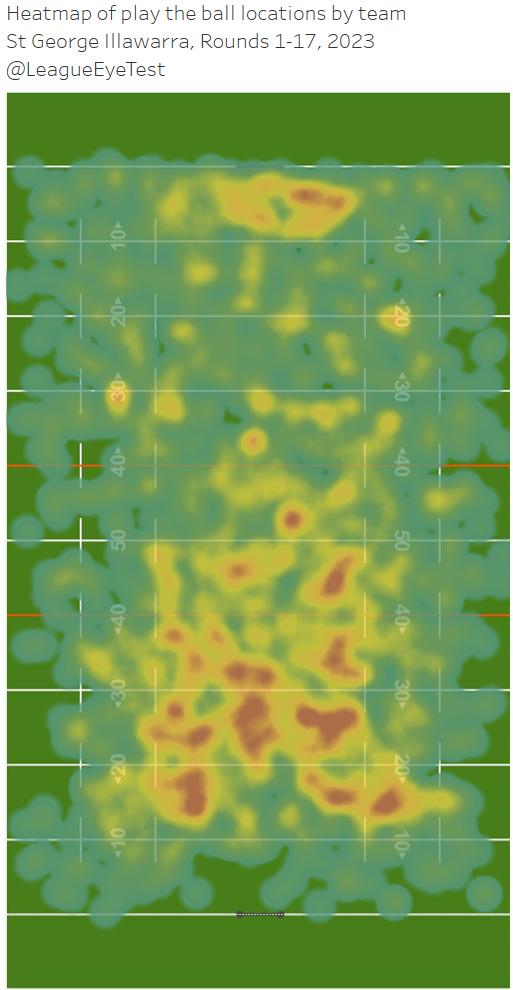
But most of their play the balls are inside their own half, and they have a higher intensity inside their own 20 metre zone than most teams. Which makes sense if they’re not pushing the ball down field, they should be seeing more play the balls in their own half.
We established before that the Dragons don’t allow a lot of metres per run, and generally keep teams away from their own line. But they’re still giving up a lot of points from further out than the 20 metre zone. Flanagan may not be the best man for the job given his baggage, but he might be the best best for right now.
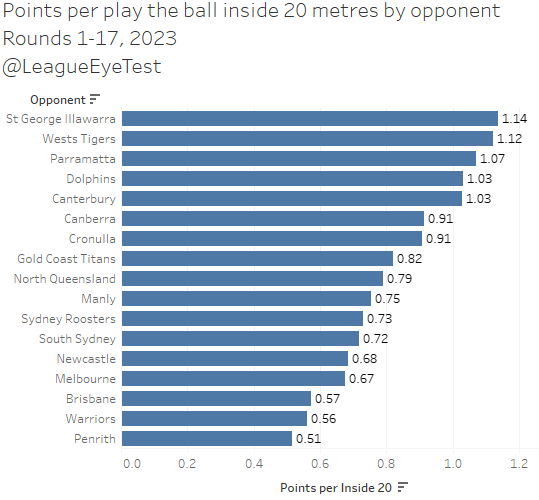
The Dragons give up an eye watering 1.07 points per tackle inside 20 metres, which basically means that if you get a full set on their goal line, you’re guaranteed points. Only the Tigers have a worse number (1.12), and they’re one of just five teams who give up more than 1.0 points per tackle inside 20. The other three are Canterbury, Parramatta and the Dolphins.
If you look at the percentage of play the balls their opponents spend inside the Dragons 20 metre zone, it becomes more apparent how porous their defense is.
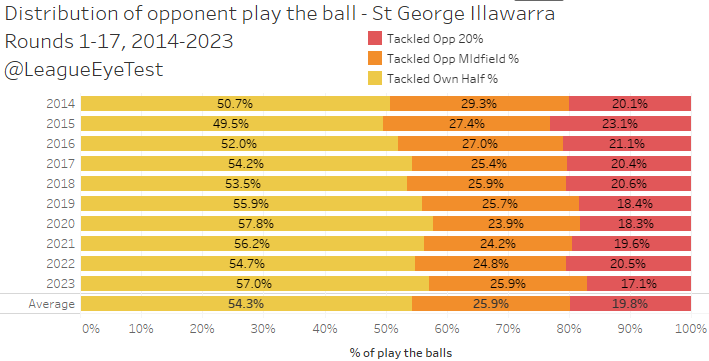
Teams facing St George Illawarra this season have seen just 17.3% of time inside twenty metres, the lowest for the Red V since I’ve started tracking these numbers in 2014. Again, this speaks volumes about where they’re conceding points from – in areas that teams don’t usually concede from which is why their point per play the ball inside 20 metres is so high.
We saw in last week’s post that they’re not a particularly bad team in terms of discipline, sitting mid table for penalties and set restarts conceded. St George Illawarra don’t give away a lot of set restarts, but they do give away the fourth most traditional penalties in the league at 6.1 per contest.
And they share something in common with the Roosters, which was identified two weeks ago, where they concede the third most penalties per set in the first half at 0.17, only trailing the Roosters (0.19) and the Bulldogs.
There’s clearly a lot of work to be done for Flanagan moving forward, and clearly the first job is getting them on the same page defensively, especially on the edges.
The club has plenty of young talent coming through but they either seem to have stagnated once they make the top grade or completely unprepared to defend at a first grade level when they do break through.
The second would be adding someone (or multiple players) to their forward pack who can generate metres without needing more touches. If Flanagan can work on those two areas we might see the Red V finally pull themselves out of the NRL doldrums.