
It’s been a quiet weekend in the NRL. No Origin build up, no star halfbacks asking for their release, no long standing try droughts broken. Just five games in a shortened round due to representative games. Nothing to see here.
That makes it a perfect time for a quick dive into penalty and set restart counts for the 2023 season up to Round 16. If you feel that your team is unfairly targeted, or that your teams’ hated rival gets all the 50/50 calls, you might find enough evidence here to support whatever point of view you have. Keep in mind I’ve previously analysed whether or not lower placed teams on the ladder get penalised more, so I won’t be treading over that ground in this piece.
First let’s take a look at the number of penalties and set restarts awarded by round for the season and comparing it to prior years. All data as usual is sourced from Fox Sports Stats.
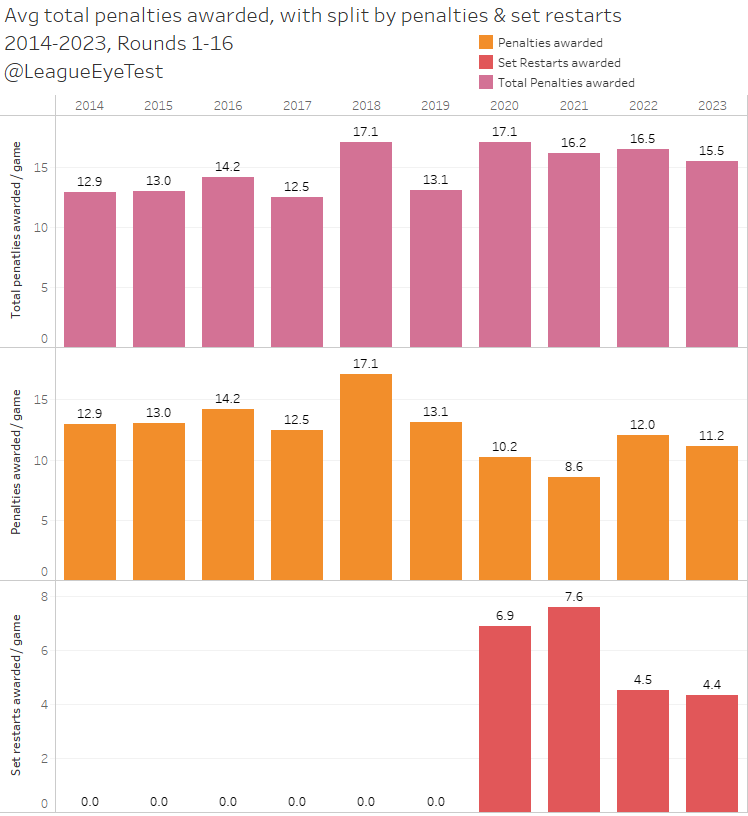
The total penalties (penalties + set restarts) have dropped one full violation this season, down from 16.5 in 2022 to 15.5 this season after 16 rounds. That number is also down from the 2020 peak of 17.1 and whatever the 2021 season was when there were 16.2.
The change comes from fewer traditional penalties, which dropped from 12.0 to 11.2, which is an interesting result considering the increased focus on contact with the head and neck.
Set restarts are largely unchanged at 4.4 this year, down from 4.5 a season ago. Which is thankfully still well below the ridiculous high of 7.6 in 2021.
What these don’t adjust for is the amount of ball in play. To get an idea of how often they’re called, the following chart takes the same data but looks at on average how many play the balls are occurring before each infringement is blown.
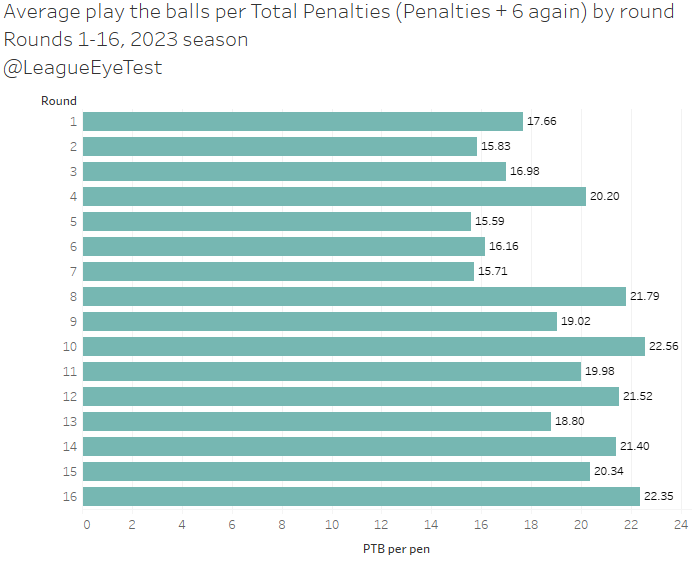
The average this season is around 19 play the balls per violation, or about three full sets of six. That number is a lot higher than the past two seasons, but down on the mid 2010s average of 21. Below is the average by round from the past two seasons.
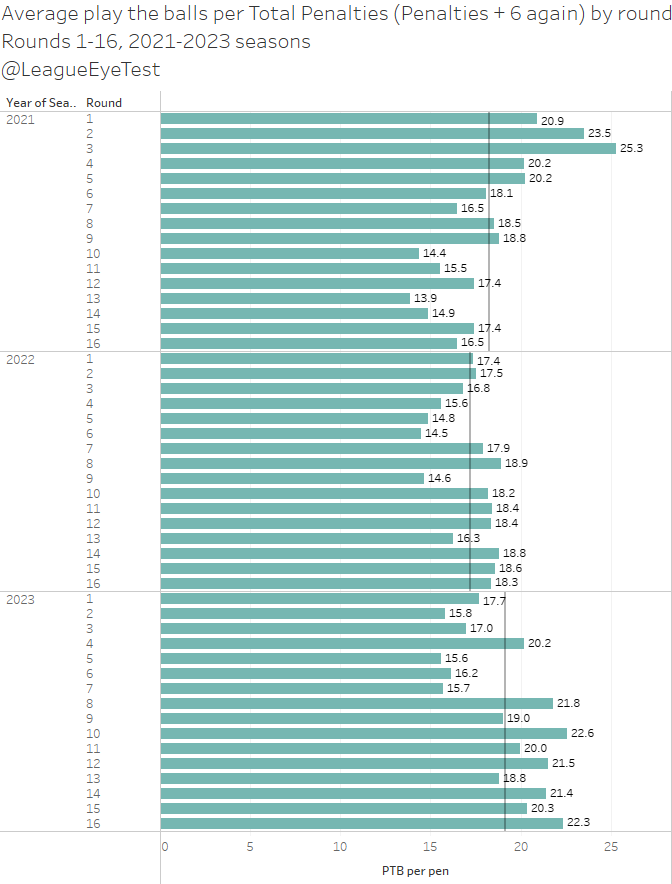
What you might notice here from looking back at the first 16 rounds of the last two seasons is that there wasn’t a single round in 2022 where the average was higher than 19 play the balls per penalty or set restart awarded. We’re slowly edging back to normal rugby league after 2020 and 2021.
Next, we’re going to break them down by halves to see what the trend is before and after the long break. Below is the first chart we looked at in this post by split by first and second halves.
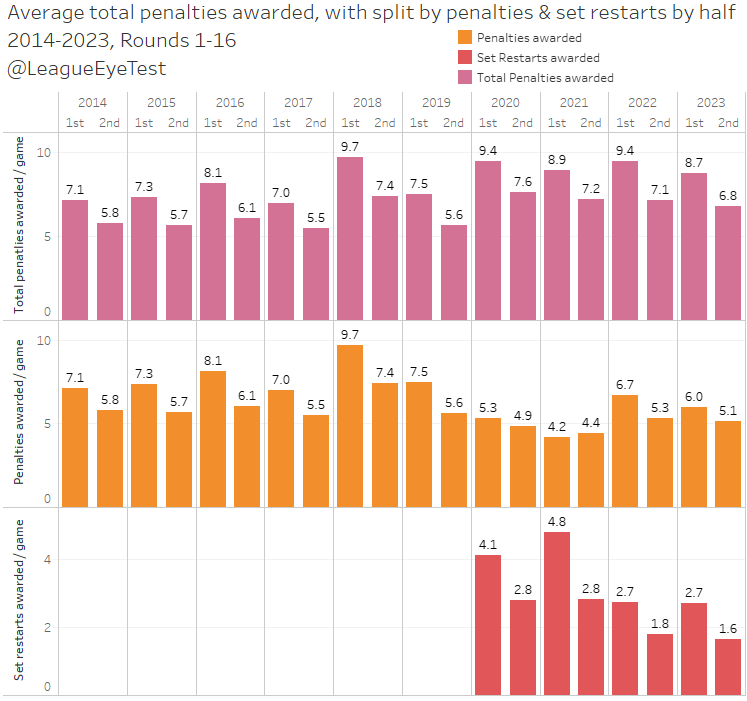
Over recent years, the trend is still similar. There is a noticeable drop after half time in the number of set restarts awarded – this year from 2.7 to 1.6) – with a minor drop in penalties.
The one thing that stands out here is that it used to be traditional penalties that dropped after half time. With the introduction of six agains/set restarts in 2020, traditional penalties are now called more evenly between halves.
In 2019, penalties dropped from 7.5 in the first half to 5.6 in the second half. This year the decline is less than one penalty, from 6.0 to 5.1. This just confirms a lot of suspicions that set restarts are awarded more frequently early in games by a referee to set the tone, and that players are adjusting to that level of strictness. Unless you’re one of those types who believe these counts are “managed”, and then you’ve got even more fuel for your theory.
Which referees are awarding the most penalties and set restarts per game? All numbers are averages due to not each referee officiating the same number of games.
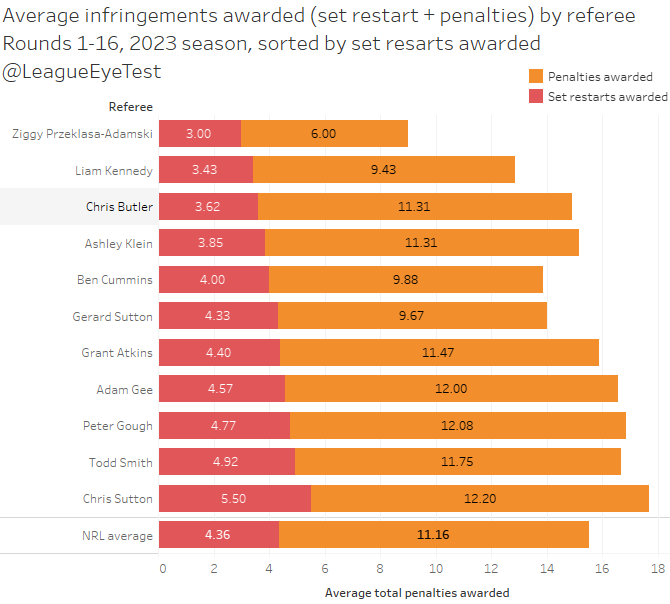
The most prolific whistle blower is Chris Sutton who not only averages the most penalties awarded per game (12.2) but also the most set restarts at 5.5. Adam Gee and Peter Gough are the only other referees to average at least 12 traditional penalties called per game, whilst no other referee averages more than 4.92 set restarts per game. Even noted six again king from prior seasons in Gee doesn’t hit five per game, but he has his own quirks (keep that in mind for later).
Ben Cummins and Gerard Sutton are the only two of the regular referees to award fewer than 10 traditional penalties per game, at 9.88 and 9.67 respectively.
I’ve left the Ziggy Przeklasa-Adamski in since we’re using averages, as he’s only presided over one game this season which had 9 infractions called. Liam Kennedy, who’s also had a small number of games in 2023 is also one of the few referees who try to stay out of the contest, averaging fewer than 10 penalties.
Are there any referees who don’t follow the trend of fewer whistles blown after half time? Below are the average number of traditional penalties and set restarts awarded by half, with first half in blue and second half in yellow.
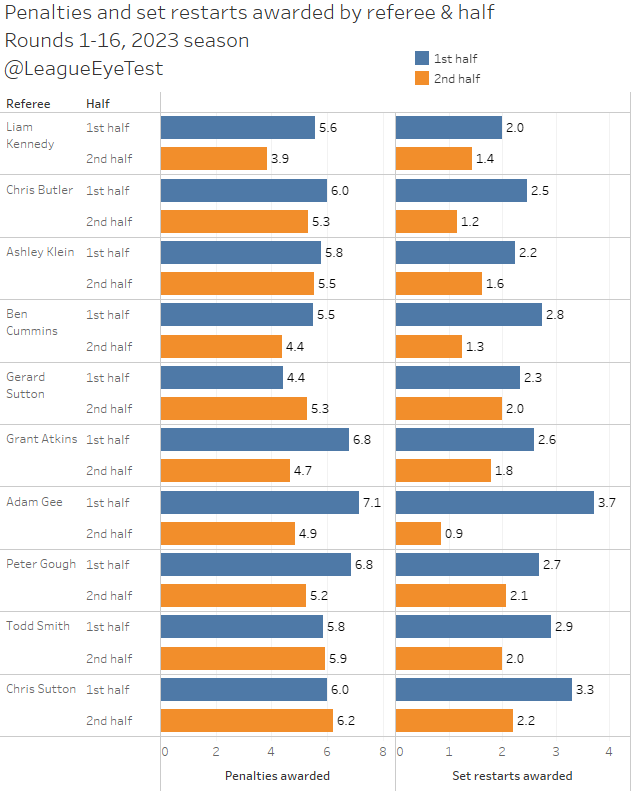
For penalties (the left column), there are a few referees who go hard early on these breaches. Most notably Grant Atkins, Gee and Gough, who average at least one more penalty awarded in the first half than second. Gerard Sutton, Todd Smith and Chris Sutton are the only referees who average more in the second half than first, although Gerard is the only one who does so at more than 0.2 penalties awarded.
The interesting one is the set restart differences, which you can see in the right column. Every referee in the competition awards more restarts earlier in games than later. This isn’t new, as it’s something we investigated on the site previously.
What is interesting is just how hard Adam Gee goes early, with 3.7 set restarts awarded in the first half but only 0.9 in the second half. That 3.7 alone is higher than the total averages for Kennedy and Butler. The only other referee who gets close to that 2.8 delta is Cummins who has a gap of 1.5 between halves.
And if you’re looking for a breakdown of captains challenges by team and referee, friend of the site Liam dove into the numbers earlier this season on the excellent Maroon Observer.
We’ve got the game wide macro view out of the way, now let’s have a look at a team by team break down of penalties and set restarts received.
First up are total infringements (penalties & set restarts) awarded and received by team.
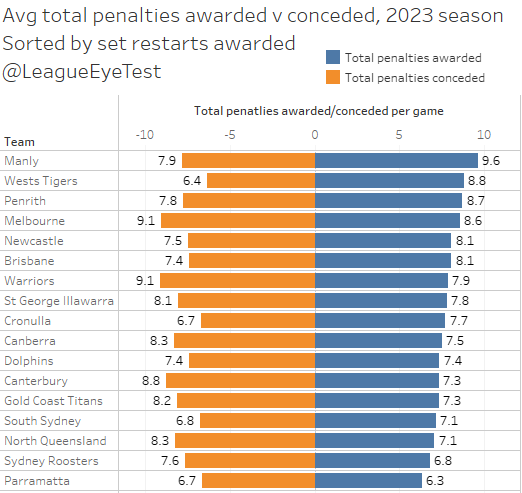
On the awarded side, Manly receive the most total penalties (penalties + set restarts), at 9.6 per game, almost one call per game ahead of the Wests Tigers in second at 8.8.
At the other end of the scale, the Roosters and Eels are the only teams to receive less than 7 calls in their favour per game, at 6.8 and 6.3 respectively.
For conceded, both the Warriors and Storm yield 9.1 total penalties per contest, with the Tigers (6.4) the best rule followers in the NRL. The Eels, Sharks and Rabbitohs also give away fewer than seven per game.
Here’s the same charts if we look at them just by traditional penalties.
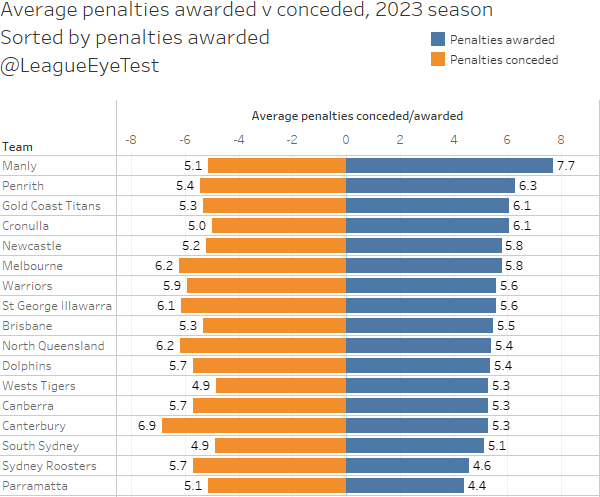
The reason for Manly taking number is clear here, averaging 7.7 traditional penalties awarded this season, a whopping 1.4 more than second placed Penrith and one of just four teams being awarded more than six per game.
The teams with the worst discipline for penalties shouldn’t be a surprise. Canterbury leads the way at 6.9 major infringement calls against them per game, which is 0.7 higher than the next worst offender North Queensland at 6.2. Traditional boundary pushers Melbourne is also averaging 6.2 calls against them this season, but as they’re receiving more than either of those two sides it is less of an issue for them.
We can also see part of the Roosters struggles that I documented last week. Their giving up 5.7 penalties per game, in the top half of the league but only receiving 4.6 of themselves, one of just two teams being awarded fewer than five penalties per 80 minutes.
And lastly here’s the same charts if we look at them by set restarts.
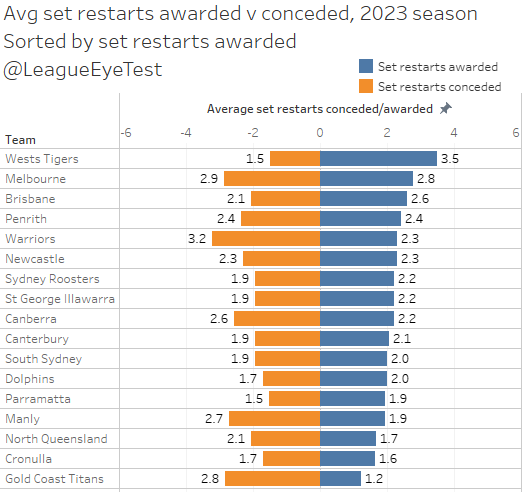
This is why the Tigers nearly topped the list previously, being awarded 3.5 set restarts per game, the only team receiving more than 3 per match. Melbourne and Brisbane were the only other teams above 2.5 per game. The Titans struggle here, being awarded just 1.2 set restarts per game, by far the lowest in the competition, and one of just five teams who receive less than two six again restarts per game.
That Titans number is compounded by the fact they give away 2.8 restarts themselves, for a net total of -1.6 per game. No wonder they’re having issues when they don’t have the ball, which as we identified previously usually happened around the 50th minute mark.
The Warriors give away the most set restarts at 3.2 per game, which is probably tied to their improved defence and confidence in keeping foes away from their try line. Canberra (2.6) and Manly (2.7) are the only other teams that concede more than 2.5 per game.
Now if we look at net total penalties (awarded minus conceded), we get an idea of who is pushing boundaries and succeeding, and which teams have poor discipline and it’s costing them points.
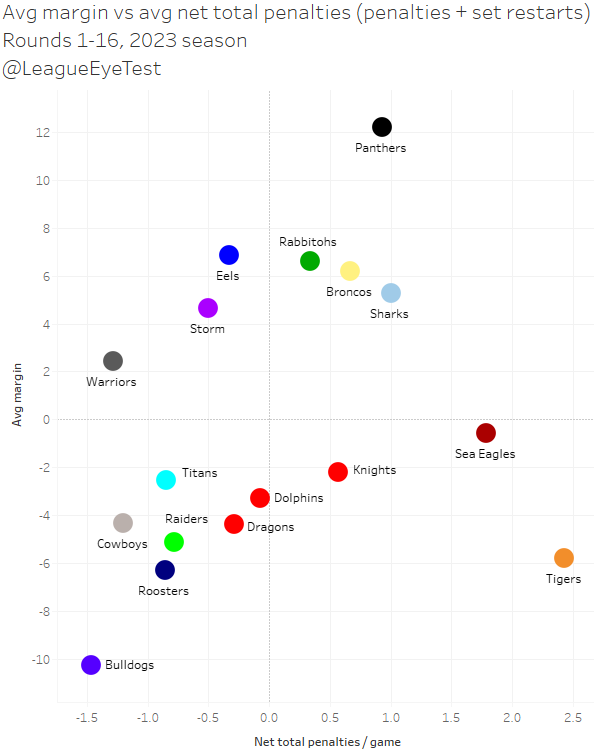
There are some interesting results here. Four of the top five have a positive net total penalty average and a positive average margin. The lone outlier is Melbourne, who have a positive margin but a negative net penalty average, which is on brand for them from the past decade. The two other teams with a positive point margin but negative net penalty margin are the Eels and Warriors, who also sit inside the top eight.
The bottom right quadrant is the most interesting. The Tigers have by far the best net total penalty margin in the competition but are unable to turn that advantage into points. Which is probably why teams are conceding set restarts to them because they know the punishment is tolerable with the Tigers inefficiency inside 20 metres.
Manly also sit inside this quadrant but that’s mainly due to the heavy defeat at the hands of Parramatta. Yet they’ve also had the benefit of more favourable whistles and still sit outside the top eight.
The bottom left quadrant is filled with the also rans of the 2023 season with one exception, that being Canberra who currently sit in 7th position on the ladder. Their location on this chart is mostly due to their slow start to the season, if we limited the numbers to post Round 6 the Raiders would be situated much closer to the middle of the chart.
To finish up this week, it’s important to keep things in perspective and note the correlation between penalties or set restarts awarded with final margin. If there even is one.
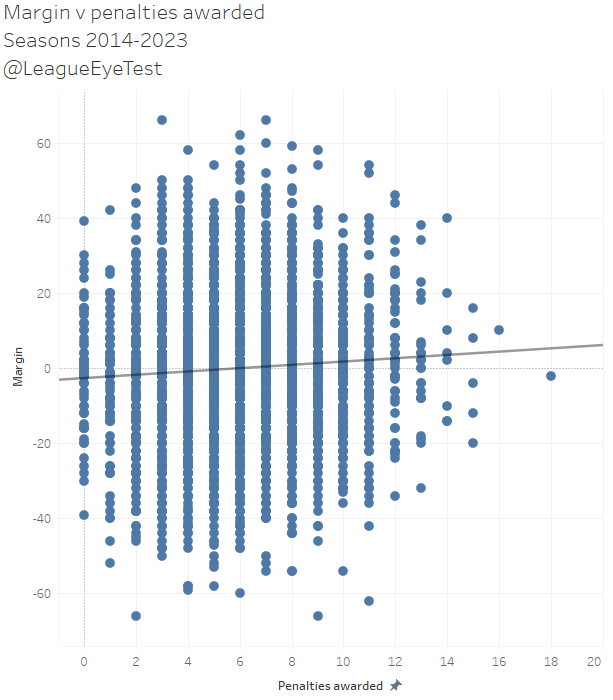
The point is that there is a very small positive correlation with penalties awarded and the size of a final margin…
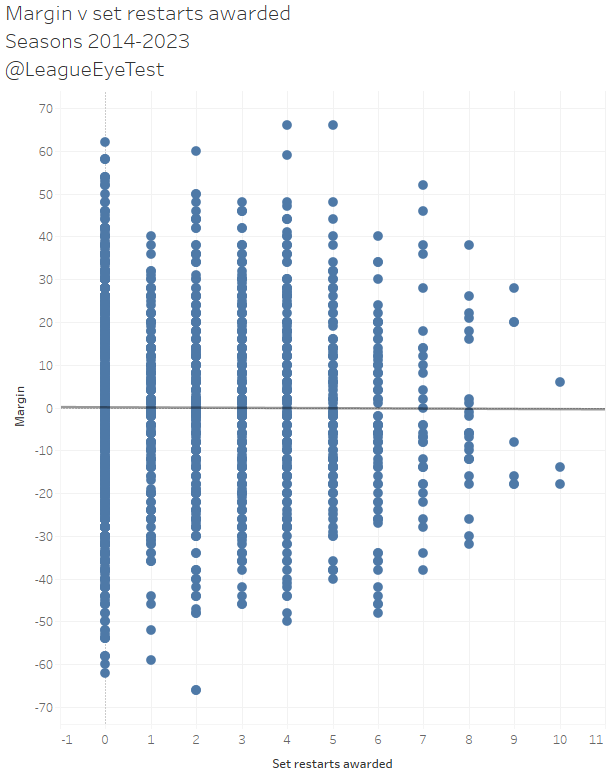
… and basically no positive or negative correlation between the number of set restarts awarded and final margin.
