There were a lot of impressive takeaways from South Sydney’s 28-6 win over the Warriors in Auckland on Friday evening. Their defense was excellent and they played an expansive game despite the treacherous conditions.
And there was one part of their victory that impressed me the most, although we’ll get to that a bit later.
But first with June complete, we’re going to do another monthly efficiency update. As usual we’re comparing the site’s expected points measure (ETXP) with actual on field scoring to gauge how efficient teams are with the ball or how porous their defence is.
If you need to catch up on the expected points model, there’s an explainer available on the site, but the elevator pitch is that each play the ball on the field is assigned a point value based on the probability of scoring a try from that position and tackle number. Possession near the try line is high value, and the further away from the line the more the value drops. Thus, if you’re scoring from further out, you’re over indexing on your expected point value.
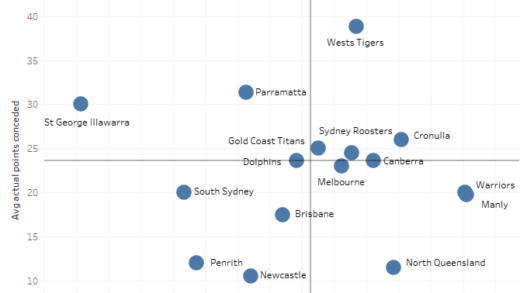
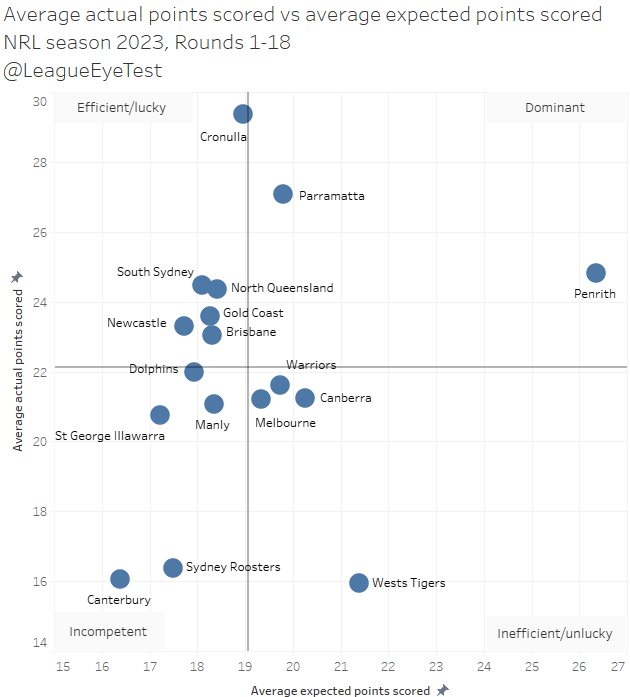
As we’ve started out previously, here’s the look at actual scoring with average points for and conceded plotted on the same chart by team after the completion of 18 rounds. We’re using average numbers here because of the bye rounds this season.
Not a lot ground breaking news here. Five of the top eight and three of the top four are scoring more than league average per game, and also conceding fewer points than league average. South Sydney are allowing a similar amount of points to the Sharks and Warriors, and also scoring at a similar rate to Penrith and North Queensland. But that’s not the impressive part. One outlier here is Newcastle, who have finally moved above league average scoring thanks to their 66-0 win over Canterbury on the weekend.
At the top end of the chart, we have the usual suspects scoring below league average and conceding bucketloads of points. The interesting one is the Roosters, who are league average in defence, but one of the worst attacking teams in the NRL, which would suggest if they could hold the ball and stop giving away cheap penalties as I wrote about a few weeks ago, they might still be in with a shot at finals football. The other outlier here is Canberra, with a -65 point differential this year but sitting in fifth position.
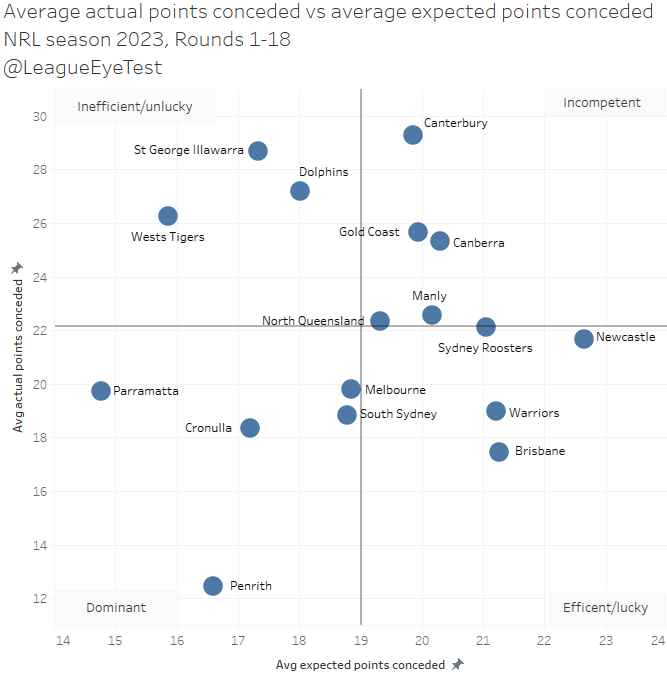
Here is the same chart but using expected points for and conceded instead of actuals. This gives you a good idea of which teams are controlling field position (Penrith) and which teams are allowing teams to walk all over them (Newcastle).
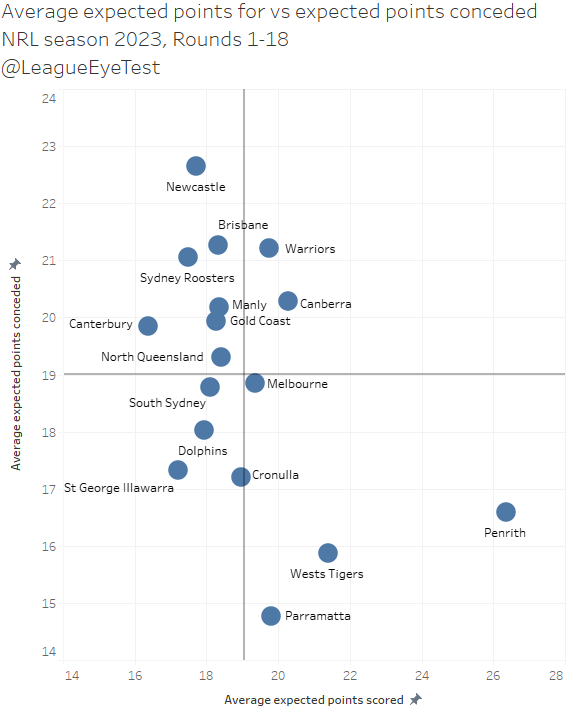
Again no huge surprises here, especially if you’ve been reading these posts all season. Penrith’s expected points from field position laps the competition. The closest team to them is the Tigers who haven’t been able to cross the line very often this season despite high point value field position. Parramatta has been great at controlling opponents field position this season, with the lowest expected point average based on field position and possession. Remember that point for later.
The rest of the NRL is pretty close together, although Newcastle is starting to separate at the top of the chart due to the average expected points they concede from allowing teams close to their line
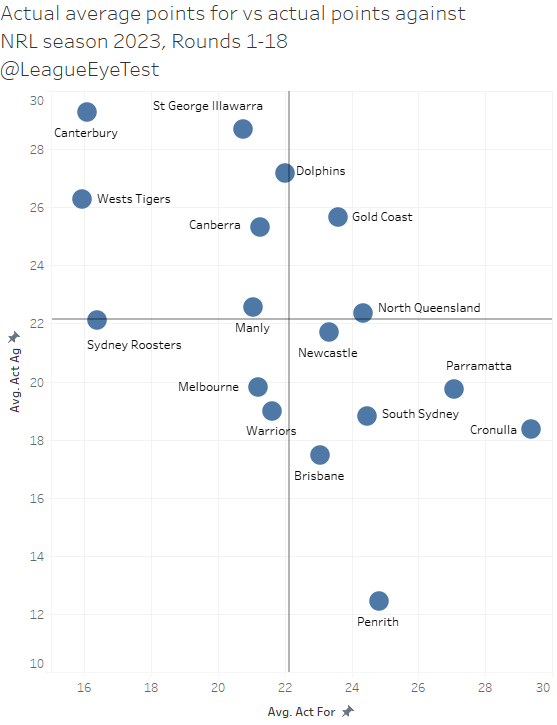
For more context, now we’ll move on to average points scored compared with average expected points.
Here is where we can start to how efficient teams are – scoring higher than your expected points total indicates you don’t need a lot of possession or to be close to the line to produce points. Inefficient teams display the opposite tendencies, they usually allow points from low value field position (e.g. outside 20 metres). Dominant teams have high expected point totals and score well, whilst the incompetent teams can’t get the ball into high value positions or cross the line.
After 18 rounds Penrith is really the only dominant team in the NRL, although Cronulla and Parramatta are straddling the efficient/dominant line. Most of the remainder of the top eight sit in the efficient quadrant, other than Melbourne and the Warriors who’ve drifted into the inefficient zone with the ball. We’ll see shortly why that isn’t an issue for either of them (for now). On this chart, Souths don’t look particularly impressive, ranking below league average in expected points gained and yielded, sharing space with the Dolphins and Dragons.
The Wests Tigers remain kings of the inefficient quadrant, as they continue to get close to the try line but rarely cross it. And the incompetent quadrant is still dominated by the Bulldogs and Roosters, who have low expected point averages and low actual points scored.
Next is average expected points conceded compared with average expected points ceded.
Here is where the Storm and Warriors low attacking efficiency is negated, as both teams are conceding fewer points than league average. Melbourne are tending more to the dominant quadrant as they are better at controlling field position, whilst the Warriors profile is similar to the Broncos in that they can defend a barrage of high point value attacking plays.
Again, we have the three worst defensive teams in the competition firmly entrenched in either the inefficient quadrant for those who give up points from low value scoring positions (Dragons, Tigers) and those who give it up from everywhere (Bulldogs).
Canberra continue to be an enigma this season, sitting in the incompetent quadrant when defending and inefficient in attack. That probably comes down to constantly allowing their opponents back into games they have no right to be in – the Raiders haven’t had a dominant win all season yet have been on the back of a number of hidings.
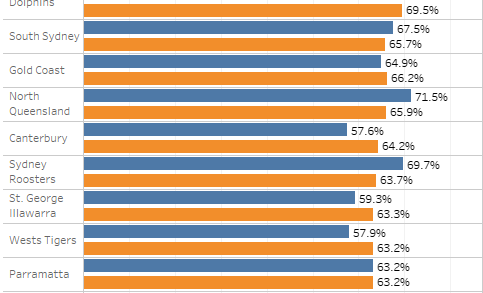
We can also look at this data by the percentage difference between expected points scored or conceded. First up is the percentage difference from expected points and actual points scored. Remember higher is better for this chart.
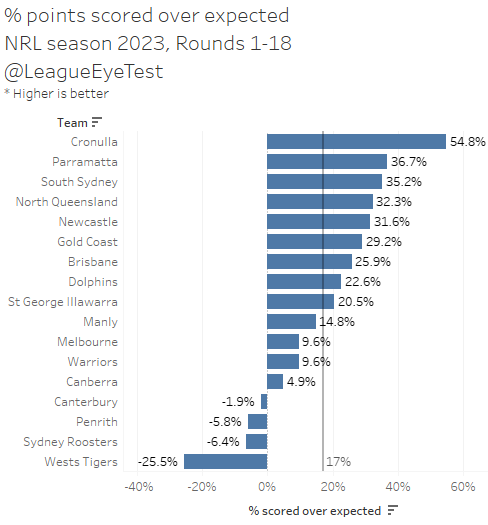
The Sharks are the most efficient team in the NRL by this metric, scoring at 55% above their expected scores. Keep in mind that the league average is +17%, but it’s still an impressive number even if you take into account their struggles against top eight teams. Here is where we start to see South Sydney’s performances stand out, and along with Parramatta they take the following two spots, with each of those teams scoring at +35% over expected.
If you want to know how much a 66 point margin can affect these numbers, the Knights were league average last week at +16%. Now they’re +32% points scored over expected thanks to the hiding they gave Canterbury. Amazing what finally scoring some long range tries can do.
On the negative side, the Wests Tigers are -25% under their expected totals thanks to being towelled up by the Cowboys. They had flirted with pushing that number above -20% with some recent results but that is out the window now. Penrith is -6% under their expected points total, which also sounds bad until you remember from the chart above that they lead the league in expected points per game at 26.4 and they’re scoring almost 25 per contest. In other words, they’re not as efficient as they could be with the scoring but given the results it’s hard to argue that they should change their suffocating style.
Now we can flip the chart and examine expected points conceded over actual points allowed. Remember lower is better for this chart.
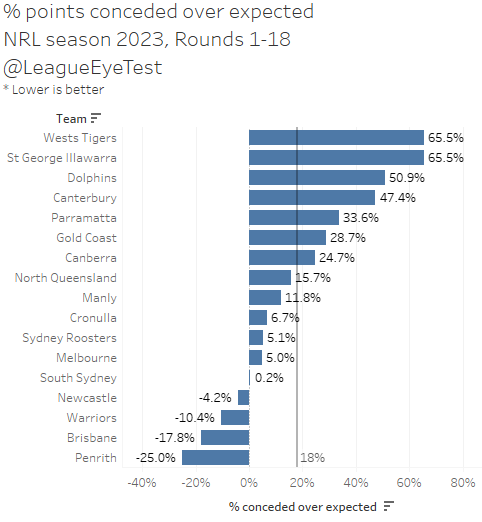
Here we have two disastrous performers – the Tigers and Dragons both allowing 65.5% more points than an average team would (insert pointing spiderman meme). Interestingly Canterbury is only fourth worst at +47%. They were still fourth worst last week and their 66 point loss added about 14% extra points over expected. The Dolphins number is the most surprising here at +51%, as they were mid table at +28% a month ago. The last few weeks with heavy losses to the Warriors, Sea Eagles and Eels have really done a number on their margins although they did scale it back a percentage point or two with a brave outing against Brisbane.
Remember that we saw earlier that the Eels yield the lowest expected points per game, denoting that they control field position very well? Unfortunately, their opponents are scoring one third more points than expected this season, which puts Parramatta in unfavourable company. It might also explain why they were outside the top eight for so long.
On the negative side, we’re starting to see some separation now with the Panthers, Broncos and Warriors defence. The Knights also have a negative percentage, but their issue in recent years has always been scoring points. The Bunnies allowing 0.2% more points than expected is well below the league average of 18%, but again that’s not the impressive part to me.
So why was the Bunnies performance so impressive on Friday? Below is a chart of the average metres allowed between each play the ball (not run metres) from tackles 2 thought 5 thus far this season. Play the ball 2 would indicate the average metres made from the play the ball of tackle 1 to the play the ball of tackel 2. I’ve not included first play the balls as they’re influenced by kick returns, and 6th because teams usually don’t get tackled on the last. Each column is coloured by it’s own legend – blue is good, orange is bad, grey is mid and the deeper the colour the better or worse each team is.
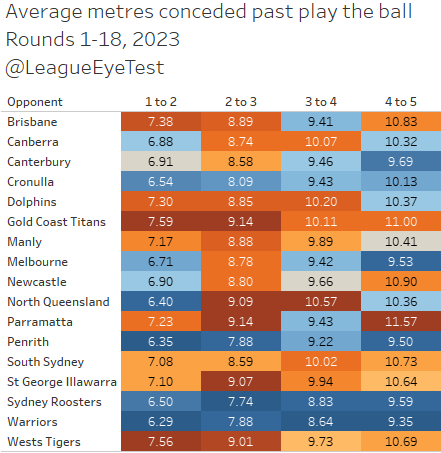
There’s plenty that can be taken away from the above chart. The first is that there’s only four teams with a shade of blue across all four play the balls in question – Penrith (duh), Cronulla the Warriors and the Sydney Roosters (!). That indicates that those teams are among the best at allowing the fewest metres past the play the ball on each of the tackles listed above.
The Roosters being here emphasises just how much of their problems are due to errors, discipline and occasional lapses and bad decision making in defence. When switched on, they rank no worse than 6th in metres between each play the ball, which shows they can defend if needed.
Because the above chart is a bit busy, I’ve produced another one with team rank rather than the average metres to make it clearer where each team sits.
And here’s where the impressive part of South Sydney’s win comes from. The Warriors allow the fewest average metres between play the balls 2, 4 and 5 of any team in the NRL, and they’re third on tackle 3. They only allow 8.64 metres between play the balls 3 and 4, and just 9.35 between 4 and 5.
To put those numbers in some perspective, the first number is lower than half the competition from tackle 2 to 3, and the latter number is almost as low as the Titans and Cowboys from play the ball 2 to 3 (9.14). They’ve dislodged the Panthers as the toughest team to gain metres on, with Penrith ranking 2nd, 2nd, 3rd and 2nd across the four play the balls we’re looking. The Warriors are as stingy as it gets when conceding yards from the ruck.
Yet South Sydney played the Warriors on their home turf and put on a clinic on one of the toughest teams in the league to gain ground on. They controlled possession, ran for more metres, including post contact where they had a triple figure advantage, despite being on the wrong end of the penalty count.
Here’s some more numbers that show how they triumphed over one of the Wahs strengths. They averaged almost 70 cm more per run than the Warriors, and over 61% of their runs were longer than 8 metres. Both of those numbers are right on South Sydney’s average for the season. Meanwhile South Sydney held them to just 7.8 metres per run, their lowest number of the season, and only 52% of runs were longer than 8 metres. Both of those numbers are well below the Warriors season averages.
The Bunnies played their usual attacking game and flourished despite the conditions and how well the Warriors had defended this season. Souths lined up perfectly to defend against the Warriors, whose average play the ball width is the closest to midfield of all NRL teams, and the wet conditions forced them to play even narrower. Souths defended an early onslaught brilliantly, and once the possession swunb back in favour of the visitors in the second half at a 2:1 ratio, the game was over.
Souths ability to gain metres downfield wasn’t the only thing that stood out to me from that game. That 2:1 possession count came from another very impressive stat for Souths – they completed 35/38 sets (92%). Now you’ll know I don’t put much weight on completion rates, but the takeaway here isn’t the completion rate, but that they committed just three errors playing their attacking brand of football in the wet.
The reason this one sticks out so much is that Souths are notorious for ranking last in my error rate metric. That measure shows the average number of touches each side has before producing an error. Last season they were last, committing an error every 32 touches of the ball.
After three rounds, they were ranked 16th, making an error every 29 touches, as noted on the site earlier this season. After nine rounds this season they were 16th, producing an error every 36 touches.
Here’s this years team error rate after 18 rounds and you might notice a change.
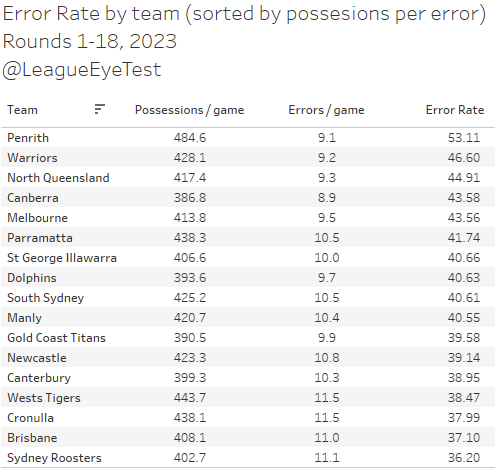
The Rabbitohs are now 9th in the NRL for team error rate, only committing one every 40.6 touches. They’re still mid field, and over a dozen possessions behind Penrith for this metric, but the improvement has been noticeable. It culminated in them only making those three errors in conditions where many teams would commit triple or quadruple that (which their opponents did).
The expected point chart for the game shows where Souths started to take over on the back of constant high value possession.
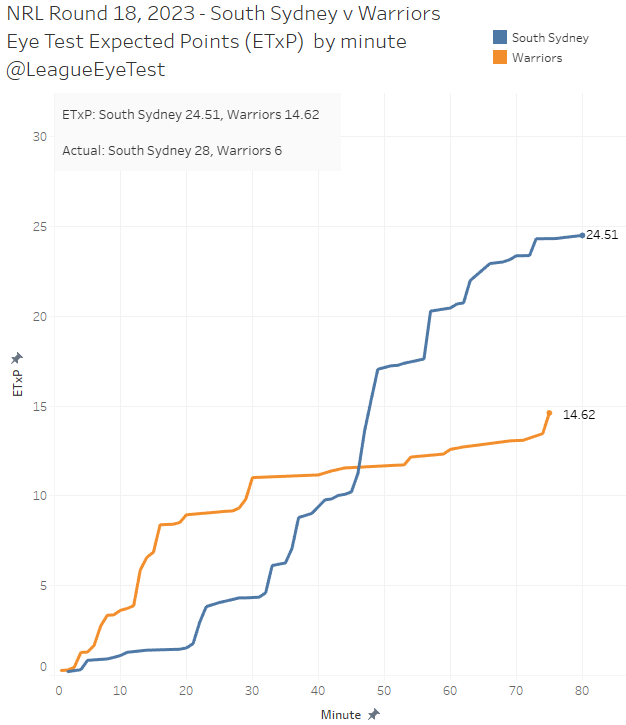
Souths largely matched their expected point total, whilst the Warriors were well under what they were expected to score. You can see how their line plateaus after 30 minutes when the Bunnies started to control the ball. And they did it without one of their key playmakers and one of their best edge defenders.
The low run metre numbers mentioned above for the Warriors on Friday come against a team that doesn’t rank highly for defending yardage by opponents past the play the ball. On 3rd play the balls South Sydney rank 6th, but on 2nd, 4th and 5th play the balls they rank in the bottom half of the NRL. They’re only one of five teams who allow more than 10 metres past the play the ball on 4th tackles, and are 13th on 5th tackles at 10.73m.
But where they do over index is with the ball, ranking 4th, 1st, 1st and 5th for metres past the play the ball on tackles two to five. Here’s the same charts as above by metres gained past the play the ball by team, first with raw numbers.

And now by rank. Remember, blue is good, orange is bad and the stronger the colour the higher or lower the ranking.
The only team that compares to South Sydney in their ability to generate metres past the ruck on those plays is Parramatta. Even Penrith, who dominate field position only rank highly on moving metres from the first to second play the ball, otherwise they sit in the bottom half of the league.
One of the key spots where South Sydney zigs whilst the league zags is late in sets. Souths make more metres past the ruck on the fourth play the ball than they do on the 5th (10.72 v 10.61), something no other team in the league does. Their tendency to move the ball wide early is something that friend of the site Mike Meehall Wood pointed out earlier in the season.
Looking at their heat map of play the ball locations for tackle three shows why that might be the case.
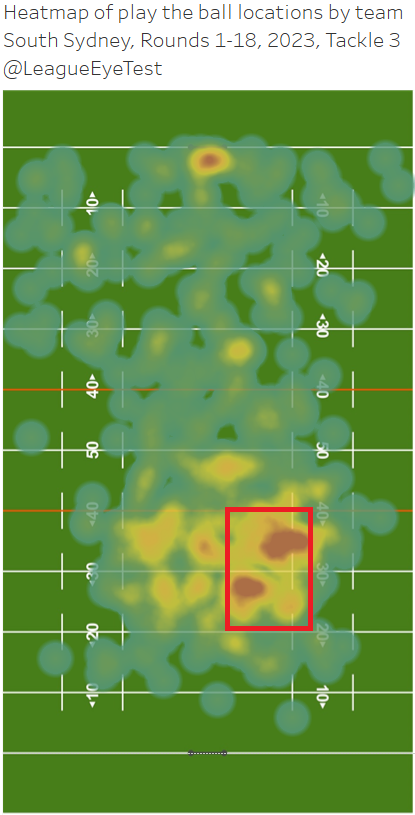
The most intense areas are on the right hand edge of the field about 20-40 metres out, which would indicate the Bunnies would be setting up for a late tackle attacking movement to their stronger left hand side. No other team in the league has a play the ball heat map profile like this on tackle 3, most of them are spread more evenly through the middle. And they did the same on Friday in spite of their opponents strength and the unfavourable conditions.
There’s a few other interesting trends here looking at distance past the ruck allowed and conceded charts above.
We touched on the Cowboys before, and they allow the third fewest metres from the 2nd play the ball (6.40m). On the next two play the balls they allow the most metres in the NRL, ranking 15th and 17th on the 3rd and 4th play the balls. They do sit mid table for the 5th play the ball, ranking 9th and allowing 10.4 metres, which means they’re focused when opponents are looking to spread the ball but they’re clearly clocking off mid set. Not that it mattered on Saturday evening with the Tigers putting up little resistance.
The Broncos ranking poorly isn’t unexpected and relates back to the numbers we looked at last month. They have confidence in their goal line defence and allowing teams to get downfield easily doesn’t faze them. As long as they can continue to keep foes from scoring under a wave of play the balls inside 20 metres at an elite level then they’re fine.
Teams like Parramatta and the Gold Coast sitting at the bottom of the league also isn’t surprising given the deep dives I’ve done into both teams this season. The Eels issue is needing a lot of possession – they’re one of the best teams at gaining ground but also one of the worst at conceding it. On from 4th to 5th play the ball the Eels allow an eye watering 11.6 metres, 17th in the NRL and one of just two teams allowing 11 or more metres on that play (the other is the Titans). Thus, if they’re not winning the possession battle, they’re going to suffer.
The Titans issue is either fitness or mental – they are top half of the competition in fewest metres allowed in the first 40 minutes but either second last or dead last on every on play the balls 2 to 5 in the second half. Their second half foibles shouldn’t come as a surprise to any Eye Test reader.
Then there’s the Knights, who despite having a number of representative forwards a strong middle, they rank 16th, 17th and 17th on metres made past the play the ball on 3rd, 4th and 5th tackles. The only reason they rank higher for 2nd tackle is due to their backs like the human wrecking ball Greg Marzhew and Dominic Young being used to get them out of trouble. Unfortunately for Newcastle, they can’t play the Dogs every week, who rank 16th, 17th, 15th and 14th on these play the balls.
It’s no coincidence that Newcastle looked good facing the only other team in the competition who struggles more than they do to make metres. Without the pill they get worse as a set continues – 8th, 9th on third and fourth play the balls and then 15th to end sets.
Back to Souths, if we look at net actual wins over expected wins we can gauge how many wins an average team would have with the same field position and possession.
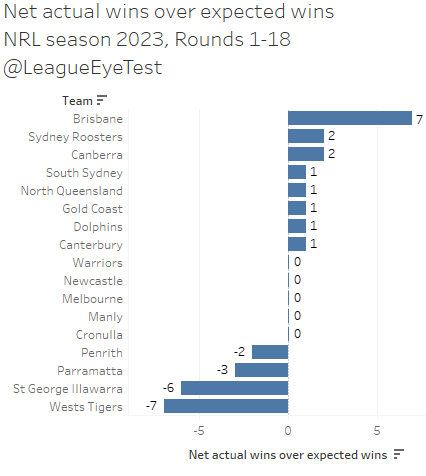
Souths are +1 on this list indicating that they’ve picked up one win over what an average team would be expected to win be based on the value of field position.
Brisbane are still leading here, at +7 wins over expected. Again this points back to the post from last month indicating that they’re winning games by backing their defence and holding out an inordinate amount of possession inside 20 metres.
On the bottom end of the scale, the Dragons and Tigers are losing games that an average team would win with the same field position and possession, again pointing to how inept they’ve been in defence as we saw previously. Both of these reclamation projects are multi year prospects at best.
We’ve seen this in prior seasons from South Sydney, where they hit their strides towards the middle and back end of the season. Ultimately their chances in September will come down to being able to defend the ball against the likes of Penrith, Brisbane and Cronulla. If they can continue to post performances like they did on Friday evening against strong defensive sides (boy it still feels weird to say that about the Warriors), and continue to improve the ball control whilst maintaining their attacking style, then there’s no reason they can’t make it all the way this season.